System maintenance in progress
System maintenance
- Some features may be temporarily unavailable.
Search
Sign In
Edit in Shortodella
Auto
2:3
Edit in Shortodella
Auto
2:3
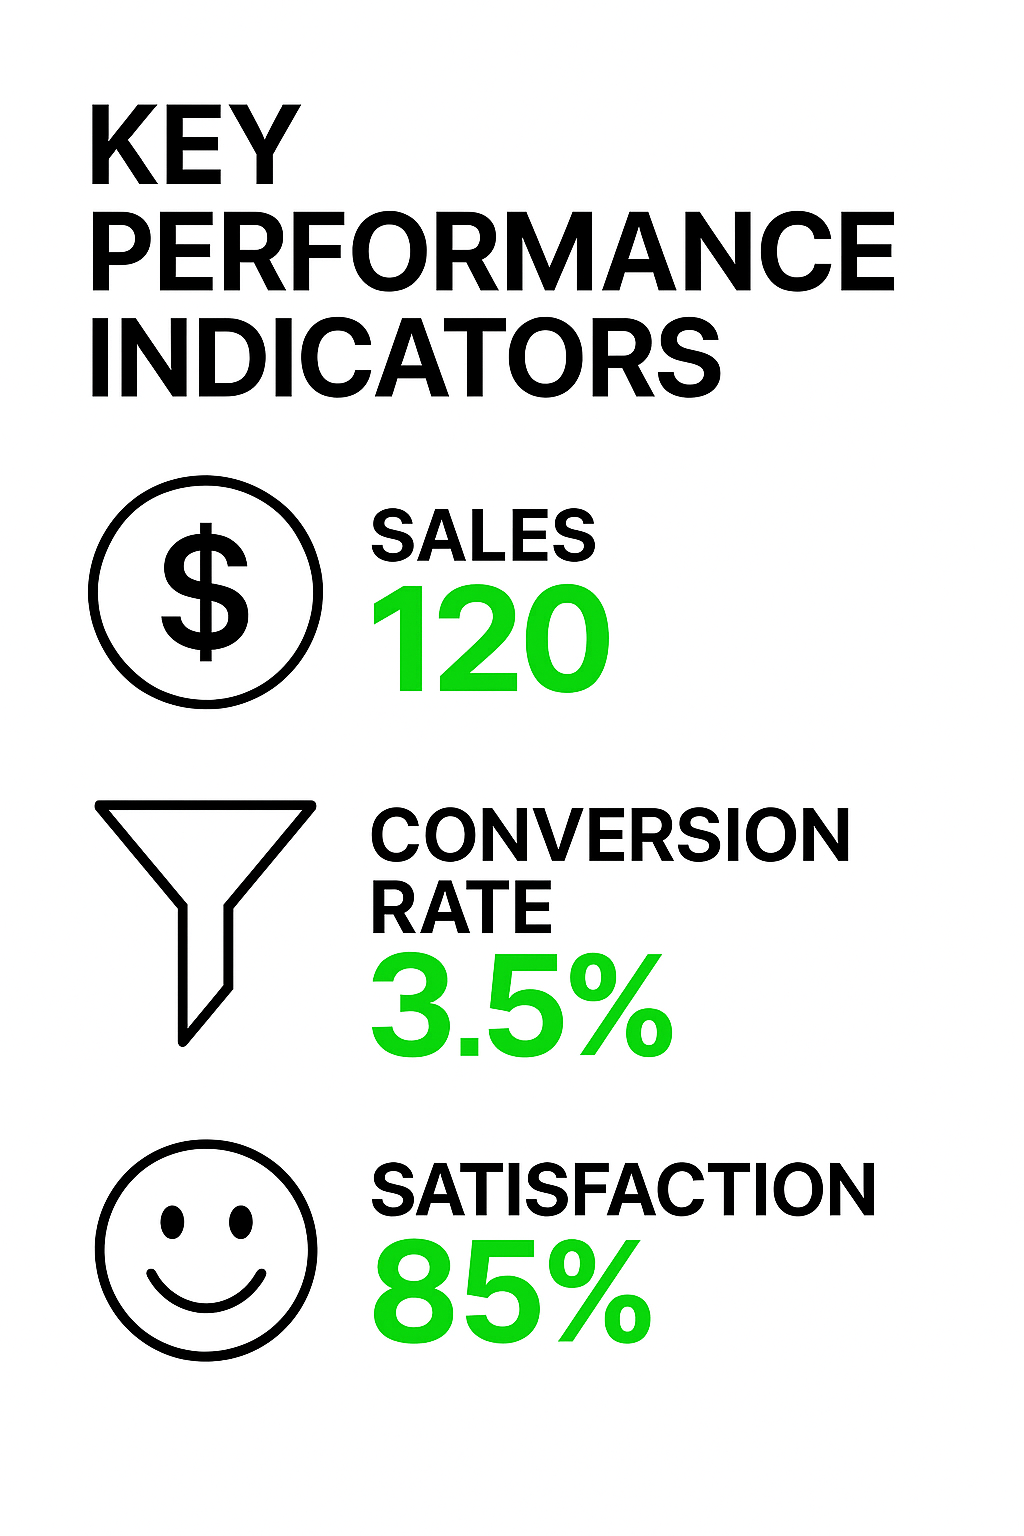
Performance Metrics Infographic with Key Indicators
/
Free
/
Collection:
Basic Green
/
by davooda
/
Type: PNG
/
Informative infographic showcasing key performance indicators with a modern, minimalist design. Ideal for business presentations or reports.
Visual Representation of Key Performance Indicators for Marketing
Graphical Representation of Performance Metrics with Bold Typography
Informative Graphic on Key Performance Indicators (KPIs)
KPI Infographic with Performance Metrics and Graphs
Informative Graphic on Key Performance Indicators
Performance Gauge Graphic Indicating Metrics
Performance Gauge Graphic with Bold Typography
Colorful Infographic on Marketing Concepts and Strategies
Performance Meter Graphic Indicating Efficiency Level
Colorful Infographic Illustrating Business Performance Metrics
Informative Graphic on Marketing Strategies and KPIs
Performance Meter Graphic with Bold Typography
Infographic Highlighting Key Performance Indicators (KPIs)
Performance Gauge Graphic with Indicator
Performance Gauge Icon with Bold Typography
Informative Graphic on Key Performance Indicators and Action Plans
Influencer Marketing Performance Dashboard Illustration
Business Performance Infographic with Graph and Happy Icon
Performance Gauge Icon with Minimalistic Design
Infographic Displaying KPI Progress Metrics with Visual Elements
Performance Gauge Icon with Red and White Color Scheme
Informative Graphic on Marketing Strategies and KPIs
Performance Growth Chart with Positive Feedback Symbol
Performance Meter Graphic with Thumbs Up Icon
Performance Indicator Graphic with Gauge and Thumbs Up
Performance Meter Graphic Indicating High Performance Level
Performance Gauge Graphic with Bold Typography
Case Study Results Highlighting Key Metrics
Stylized Graphic Representing Key Performance Indicators
Infographic on Key Business Strategies and Metrics
Infographic on Influencer Marketing Performance Metrics
Infographic on Influencer Marketing Performance Metrics
Performance Gauge Illustration with Clear Indicators
Digital Marketing Performance Graphic with Data Visualization
Performance Meter Graphic Illustrating Measurement Concept
Performance Growth Chart with Positive Feedback
Business Strategy Infographic Highlighting Key Metrics and Actions
Informative Graphic on Business Strategies and Metrics
Informative Graphic on Key Performance Indicators (KPIs)
Data Visualization for Influencer Marketing Performance
Illustrative Infographic on Key Performance Indicators (KPI)
3D Red Arrow Icon Illustrating Marketing Performance Metrics
Informative Infographic on Business Strategies and Metrics
Informative Graphic on KPI Posts and Lead Generation
Influencer Marketing Performance Report Graphic
Performance Indicator Graphic with Hand and Gauge
KPI Performance Metrics Graphic for Business Analysis
3D Infographic on Conversion Rate Calculation
Graphical Representation of Customer Needs Growth
Performance Meter Graphic with Hand Interaction
Performance Gauge Graphic with Engaging Visual Elements
Informative Infographic on Campaign Performance Metrics
Influencer Marketing Performance Graphic with Data Visualization
Data Visualization of User and Revenue Growth Metrics
Influencer Marketing Performance Metrics Graphic
Informative Graphic on Marketing Strategies and KPIs
Informative KPI Graphic for Business Metrics
Influencer Marketing Performance Analysis Graphic
Informative Graphic on Post KPIs and Performance Measurement
Influencer Marketing Performance Data Visualization
Infographic on SEO Strategies with Action Plan Elements
E-commerce Marketing Infographic with Key Concepts
Comparison Infographic of Post Performance Metrics
Influencer Marketing Performance Analysis Graphic
Performance Measurement Graphic with Gauge Illustration
Data Visualization of Influencer Marketing Performance Over Time
Stylized Financial Growth Chart with Dollar Coin
Infographic Elements Representing Marketing Metrics and Strategies
Infographic on Marketing Strategies with Visual Icons
Performance Gauge Graphic with Hand Interaction
Colorful Infographic Representing KPI and Action Plan Concepts
Positive Growth Indicator with Thumbs Up Symbol
Informative Graphic on Tracking Website Performance Metrics
Illustrative Graphic on Growth Metrics and Financial Trends
Influencer Marketing Performance Graphic with Engaging Visuals
Case Study Results Visual with Graphs and Statistics
Informative Graphic Representing Business KPIs and Marketing Strategies
Performance Indicator Graphic with Positive Feedback
Data Visualization for Influencer Marketing Performance
Modern KPI Dashboard Displaying Performance Metrics
Email Marketing Performance Infographic Highlighting Key Metrics
Autumn-Themed Infographic with Key Statistics
Performance Rating Graphic with Star Metrics
KPI Comparison Graphic with Smartphone Illustrations
Futuristic Blue Abstract Background with Geometric Elements
Performance Indicator Graphic with Positive Feedback
Minimalist Analytics Illustration with Graphs and Data
Marketing Performance Dashboard Graphic
3D Web Design with Key Metrics Visualization
E-Commerce Trends Infographic with Engaging Visual Elements
Infographic Highlighting Case Study Results with Graphical Elements
Stylized 3D Bar Graph Showing Growth Trend
User Demographics Bar Chart with Age Distribution
Minimalist Icon Graphic with Heart and Paper Plane
Holiday Insights Infographic with Statistics and Visual Elements
3D Illustration of Conversion Funnel Concept
Illustration of Interlocking Gears in Different Sizes
Dynamic Financial Chart with Rising Trends and Urban Background
Modern Graph Icon Illustrating Growth and Progress
Social Media Post KPI Comparison Graphic
Informative Graphic on KPI Metrics for Performance Evaluation
KPI Infographic for Data Visualization and Analysis
Infographic on Software Development Metrics with Illustrative Style
Informative Graphic on Key Performance Indicators (KPIs)
Business Audit Infographic with Key Performance Indicators
Customer Satisfaction Infographic with Diverse Employee Representation
Traffic Analysis Infographic with Growth Metrics
Business Performance Analysis Graphic with Trend Chart
Infographic on Network Server Performance Metrics
Futuristic Network Infographic Design with Key Features
Business Conference Promotion with Key Metrics
Neighborhood Features Infographic with Minimalist Icons
Colorful Infographic Design Illustrating Data Visualization Concepts
Neighborhood Features Infographic with Icons and Text
Market Analysis Graphic with Data Visualization
Employee Satisfaction Infographic with Key Metrics
Professional Data Presentation and Evaluation Graphic
Cloud Computing Infographic with Visual Elements
Modern Data Transfer Infographic with Growth Metrics
Customer Reviews Infographic Highlighting Company Benefits
Modern Infographic on Cloud Computing Advantages
Financial Growth Infographic with Investment Insights
Holiday Sales Analytics Infographic with Visual Elements
Data Analysis Infographic for Revenue Insights
Dynamic Data Transfer Infographic with Modern Design
Employee Benefits Infographic with Iconography
Business Growth Promotion Graphic with Chart Elements
Infographic Highlighting Business Statistics with Rocket Theme
Cloud Computing Infographic Highlighting Key Benefits
Informative Product Features Graphic with Icons
Service Offerings Infographic with Icons and Text
Market Analysis Infographic with Data Highlights
Achievement Recognition Graphic Featuring Success Metrics
Modern Data Analysis Graphic with Insights Theme
Cloud Computing Infographic Highlighting Advantages
Data Analytics Illustration with Graphs and Percentages
Statistics and Data Analysis Infographic with Neon Elements
Results Infographic Highlighting Winning Strategies
Technology Networking Infographic with Efficiency Metrics
Business Audit Infographic for Financial Strategy Insights
Professional Data Analysis Presentation Graphic
Financial Insights Dashboard for Analysis
Modern Technology Infographic Highlighting Network Efficiency and Security
Goal Tracking Illustration with Growth Metrics
Modern Tech Infographic on Global Connectivity
Professional Growth Achievement Graphic with Progress Bar
Infographic on Competitive Advantages in Business Strategy
Neighborhood Exploration Infographic with Icons
Modern Presentation Slide with Data Visualization
Infographic on Statistics and Data Analysis in Neon Design