System maintenance in progress
System maintenance
- Some features may be temporarily unavailable.
Search
Sign In
Edit in Shortodella
Auto
2:3
Edit in Shortodella
Auto
2:3
Informative Graphic on Key Performance Indicators (KPIs)
/
Free
/
Collection:
Let's Present
/
by davooda
/
Type: PNG
/
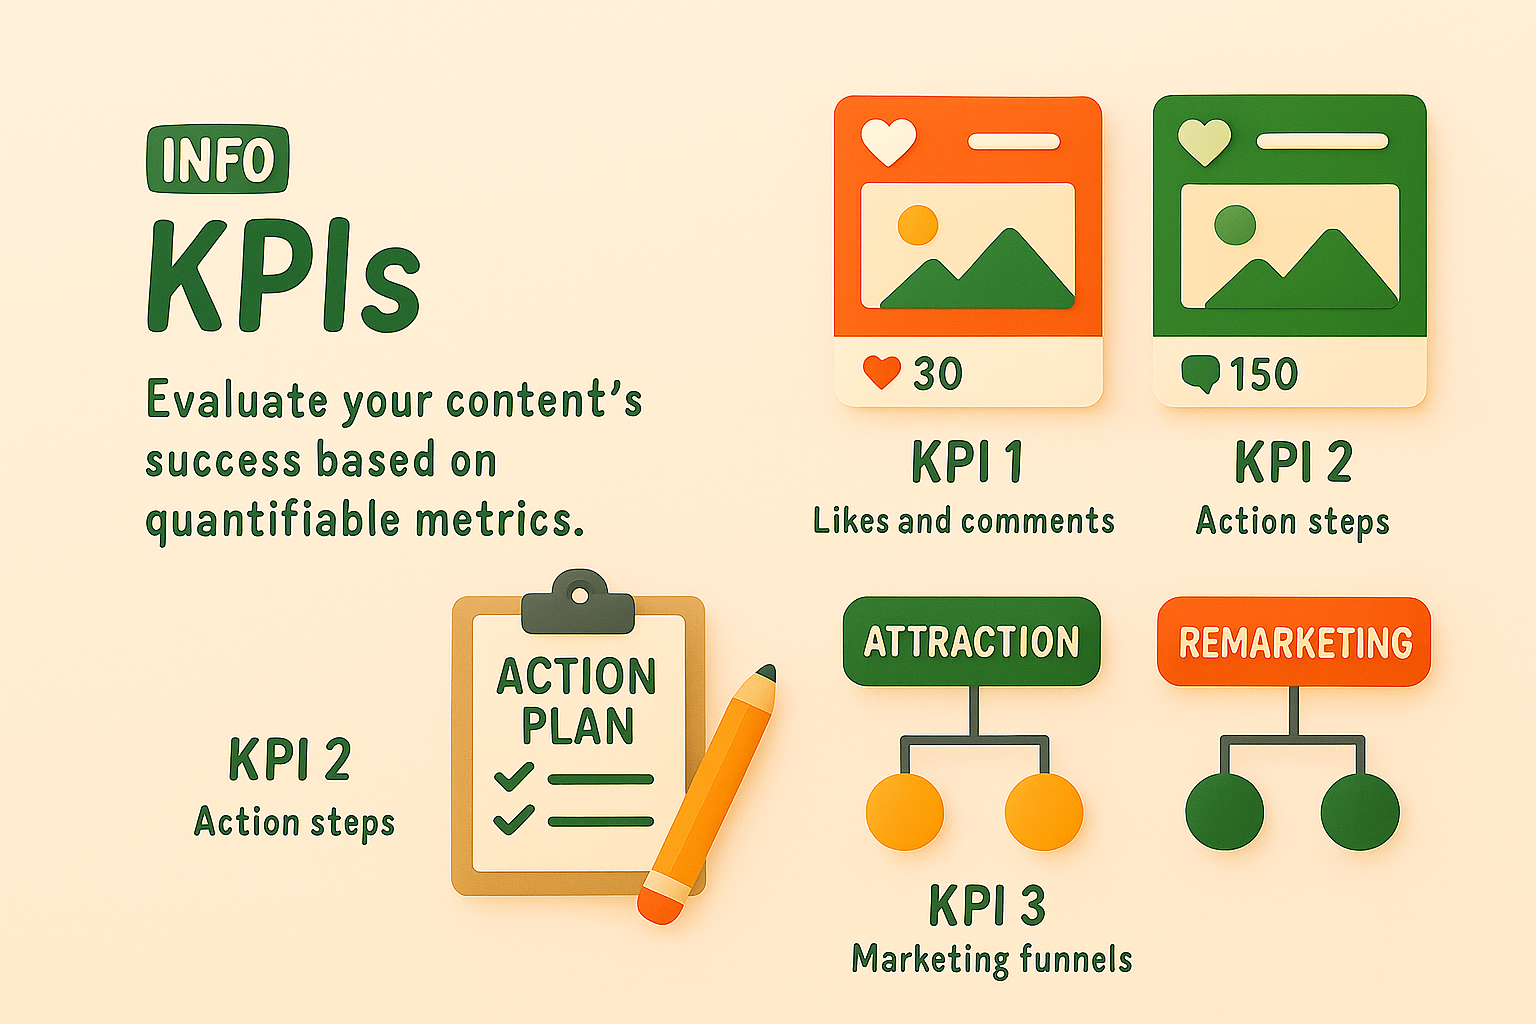
Colorful infographic illustrating key performance indicators (KPIs) for content evaluation, featuring distinct sections for likes, comments, action steps, and marketing funnels, ideal for digital marketing presentations.
Informative KPI Graphic for Business Metrics
Informative Graphic on Marketing Strategies and KPIs
Colorful Infographic Representing KPI and Action Plan Concepts
Informative Graphic on Key Performance Indicators (KPIs)
KPI Infographic for Data Visualization and Analysis
Marketing Performance Dashboard Graphic
Informative Graphic on KPI Posts and Lead Generation
Colorful Infographic on Marketing Concepts and Strategies
Illustrative Infographic on Key Performance Indicators (KPI)
Infographic Displaying KPI Progress Metrics with Visual Elements
Colorful Infographic Illustrating Business Performance Metrics
Informative Graphic on Business Strategies and Metrics
Infographic Highlighting Key Performance Indicators (KPIs)
Informative Graphic on Post KPIs and Performance Measurement
Informative Graphic on Key Performance Indicators and Action Plans
Informative Graphic on Marketing Strategies and KPIs
Informative Graphic on Marketing Strategies and KPIs
Informative Graphic Representing Business KPIs and Marketing Strategies
Informative Infographic on Business Strategies and Metrics
Informational Graphic on Web Metrics and Strategies
Digital KPI Comparison Graphic for Social Media Posts
Infographic on Key Business Strategies and Metrics
Infographic Elements Representing Marketing Metrics and Strategies
Informative Graphic on Key Performance Indicators
KPI Performance Metrics Graphic for Business Analysis
KPI Comparison Graphic with Smartphone Illustrations
Stylized Graphic Representing Key Performance Indicators
Informative Graphic on Key Performance Indicators (KPIs)
Social Media Post KPI Comparison Graphic
Infographic on SEO Strategies with Action Plan Elements
Informative Graphic on KPI Metrics for Performance Evaluation
Infographic on Marketing Strategies with Visual Icons
Business Strategy Infographic Highlighting Key Metrics and Actions
3D Illustration on Content Marketing Strategy
E-commerce Marketing Infographic with Key Concepts
KPI Infographic with Performance Metrics and Graphs
Illustrative Diagram for Cybersecurity Planning and Metrics
Illustrative Action Plan Infographic for Goal Setting
Visual Representation of Key Performance Indicators for Marketing
Visual Illustration of AI Integration in Marketing Strategies
Creative Graphic on Hashtag Content Strategy
Informative Graphic on Cybersecurity Metrics and Strategies
Comparison Infographic of Post Performance Metrics
Minimalist Analytics Illustration with Graphs and Data
Infographic on Content Monetization Strategies
KPI Post Comparison Graphic with Illustrated Tablets
Visual Representation of Social Media Engagement Metrics
3D Infographic on Conversion Rate Calculation
Content Planning Graphic with Strategic Workflow Elements
Positive Growth Indicator with Thumbs Up Symbol
Playful Graphic on Content Creation Strategies
Informative Graphic on Tracking Website Performance Metrics
User Engagement Concept Illustration with Social Media Icons
Social Media Content Planning Calendar Graphic
Performance Metrics Infographic with Key Indicators
Infographic Illustrating Action Steps for Project Management
Content Monetization Graphic with Earnings Overview
YouTube Analytics Visualization for Performance Tracking
Infographic on Influencer Marketing Performance Metrics
Informative Graphic on Cybersecurity Strategies
Performance Growth Chart with Positive Feedback Symbol
Modern KPI Dashboard Displaying Performance Metrics
Colorful Informational Graphic on Marketing Concepts
Data Visualization of User and Revenue Growth Metrics
Illustrative Graphic on Content Management Concept
Content Monetization Analytics Graphic
Business Professional Analyzing Graphs and Charts
Creative Illustration on Content Monetization Strategies
Colorful Infographic Design Illustrating Data Visualization Concepts
Conceptual Graphic for Content Monetization Tracking
Stylized 3D Bar Graph Showing Growth Trend
Infographic on Influencer Marketing Performance Metrics
Dynamic Data Analysis Presentation Illustration
Infographic on Audience Analysis for Influencer Engagement
Promotional Graphic for Content Monetization Tracking Tool
Data Analytics Illustration with Graphs and Percentages
Illustrative Graphic on Influencer Marketing Analytics
Data Analytics Promotional Graphic with Modern Design Elements
Influencer Marketing Performance Report Graphic
Digital Marketing Performance Graphic with Data Visualization
Infographic on Audience Segmentation with Pie Chart
Dynamic Landing Page Design with 3D Elements
Stylish Blue Background with Geometric Shapes and Icons
Content Planning Infographic with Calendar and Flowchart
Illustrative Graphic on Content Monetization Strategies
Creative Business Planning Concept with Sticky Notes
Influencer Marketing Performance Dashboard Illustration
Dynamic Goal Tracker Board with 3D Elements and Gradient Background
Illustrative Graphic on Growth Metrics and Financial Trends
Minimalist Landing Page Design with Engaging Elements
3D Illustration of Content Management System Concept
Performance Meter Graphic with Thumbs Up Icon
Visual Representation of Content Strategy Planning
Engaging Digital Marketing Infographic on Call to Action Strategies
3D Laptop with Rising Graph and Charts on Purple Background
Performance Gauge Graphic with Bold Typography
Bullseye Target with Arrow Hitting Center at Sunset
Influencer Marketing Performance Graphic with Data Visualization
Performance Gauge Graphic Indicating Metrics
Influencer Marketing Performance Analysis Graphic
Informative Product Features Graphic with Icons
Business Audit Infographic with Key Performance Indicators
Customer Reviews Infographic Highlighting Company Benefits
Email Marketing Performance Infographic Highlighting Key Metrics
Cloud Computing Infographic with Visual Elements
Business Analytics Concept with KPI Dashboard Visuals
Professional Data Presentation and Evaluation Graphic
Informative Graphic on Social Media Engagement
Informative Graphic on AI Integration and Key Performance Indicators
Infographic on Software Development Metrics with Illustrative Style
Infographic on Key Elements of Innovation
Digital Data Exploration and Analytics Graphic
Informative Graphic on Digital Marketing Strategies
Market Analysis Graphic with Data Visualization
Illustrative Graphic on Return on Investment Concepts
Informative Graphic on Trends for Viral Video Content
Informative Graphic on Gas Fees with Illustrative Elements
Informative Graphic on Influencer Marketing Strategies
Neighborhood Features Infographic with Icons and Text
Informative Infographic on Campaign Performance Metrics
Cloud Computing Infographic Highlighting Key Benefits
Infographic on Network Server Performance Metrics
Colorful Infographic Design with Data Visualization Elements
Informative Graphic on Christmas Candle Statistics
Traffic Analysis Infographic with Growth Metrics
Service Offerings Graphic with Icons and Text
Modern Information Technology Graphic with Key Focus Areas
Customer Satisfaction Infographic with Diverse Employee Representation
Infographic Illustrating Steps in a Process
Professional Presentation Slide with Key Points and Visual Data
Informative Graphic on Cannabis Health Benefits
Neighborhood Exploration Infographic with Icons
Modern Infographic on Data Transfer Concepts
Infographic Highlighting Case Study Results with Graphical Elements
Futuristic Network Infographic Design with Key Features
Keyword Research Graphic for SEO Strategies
Business Audit Infographic for Financial Strategy Insights
Computer Security Infographic Illustrating Key Concepts
Informative Graphic on Social Media Algorithms for Engagement
Marketing and Sales Strategy Graphic with Key Points
Engaging Research Summary Graphic Highlighting Key Statistic
Financial Dashboard Visualization with Data Insights
Colorful Pears with Antioxidant Benefits - Informative Graphic
Informative Graphic on Health Benefits of Cannabis
Interactive Data Dashboard Promotional Graphic
Illustrative Guide for Referral Program Implementation
Informative Infographic About the Sun's Characteristics
Modern Presentation Slide with Data Visualization Elements
Informative Backyard Gardening Infographic with Growth Statistics
Modern Infographic on Cloud Computing Advantages