System maintenance in progress
System maintenance
- Some features may be temporarily unavailable.
Search
Sign In
Edit in Shortodella
Auto
2:3
Edit in Shortodella
Auto
2:3
Infographic Highlighting Key Performance Indicators (KPIs)
/
Free
/
Collection:
Let's Present
/
by davooda
/
Type: PNG
/
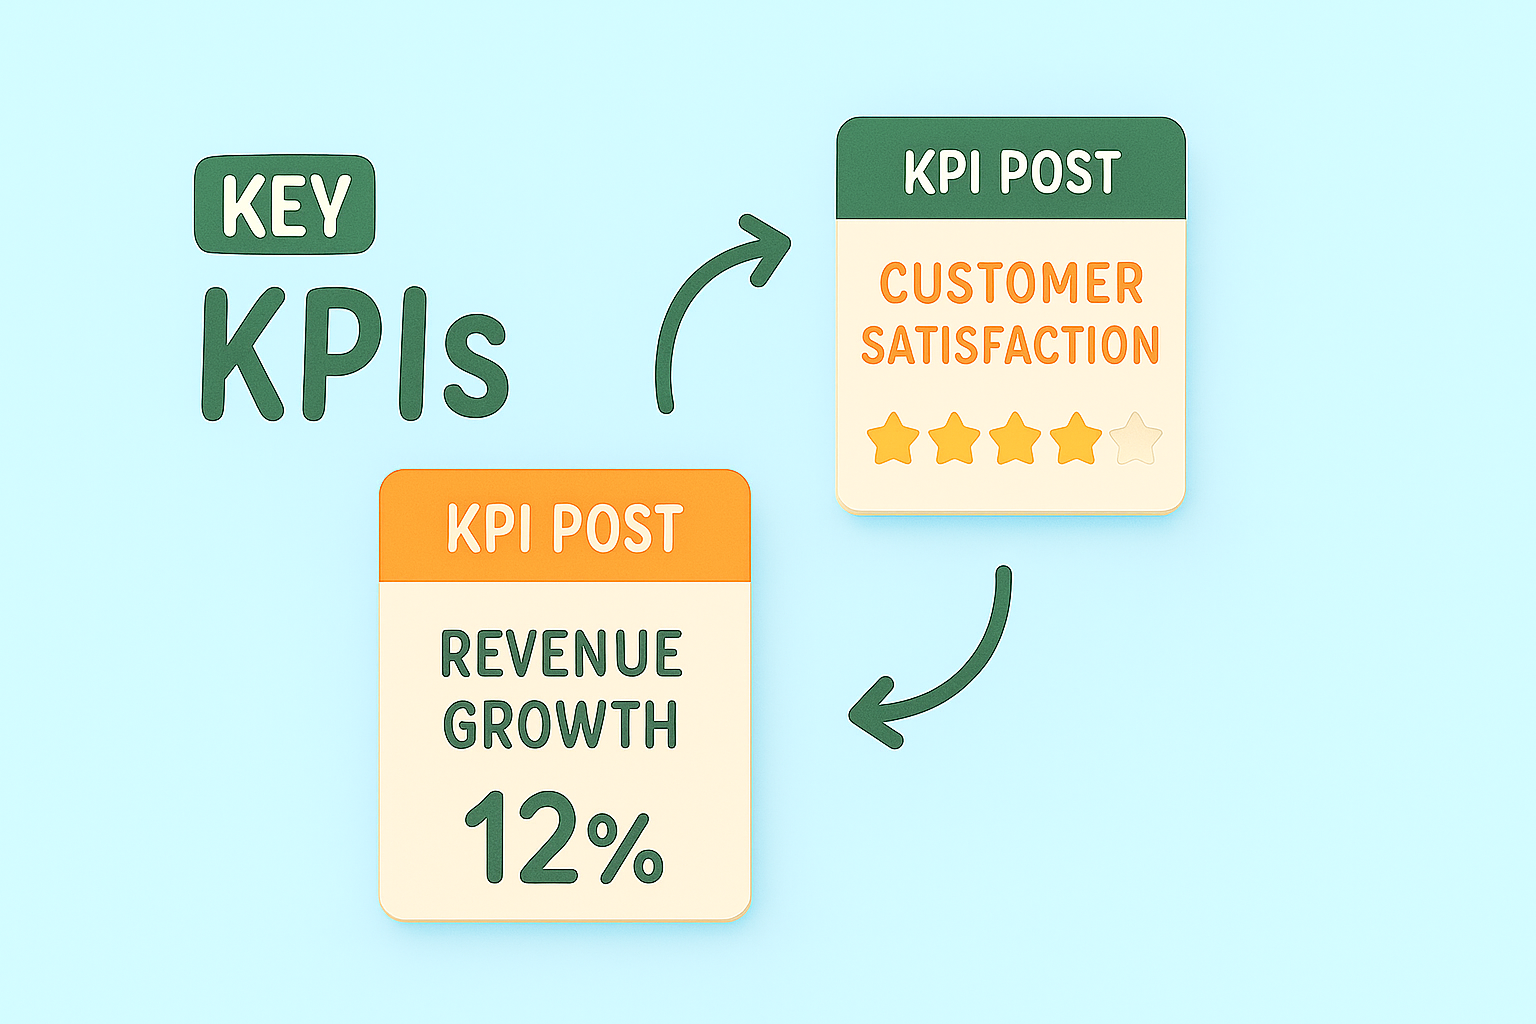
Modern infographic showcasing key performance indicators, focusing on customer satisfaction and revenue growth. Ideal for business presentations and reports.
KPI Performance Metrics Graphic for Business Analysis
Informative Graphic on Key Performance Indicators (KPIs)
KPI Comparison Graphic with Smartphone Illustrations
Infographic Displaying KPI Progress Metrics with Visual Elements
Informative KPI Graphic for Business Metrics
Marketing Performance Dashboard Graphic
Social Media Post KPI Comparison Graphic
Informative Graphic on Key Performance Indicators
Informative Graphic on Key Performance Indicators (KPIs)
Colorful Infographic Illustrating Business Performance Metrics
Stylized Graphic Representing Key Performance Indicators
Informative Graphic on Marketing Strategies and KPIs
Informative Graphic on KPI Posts and Lead Generation
KPI Infographic with Performance Metrics and Graphs
Illustrative Infographic on Key Performance Indicators (KPI)
Digital KPI Comparison Graphic for Social Media Posts
KPI Post Comparison Graphic with Illustrated Tablets
Visual Representation of Social Media Engagement Metrics
Business Strategy Infographic Highlighting Key Metrics and Actions
Informative Graphic on KPI Metrics for Performance Evaluation
Informative Graphic on Post KPIs and Performance Measurement
Stylized Graph Showing Financial Growth with Dollar Coin
Colorful Infographic Representing KPI and Action Plan Concepts
KPI Infographic for Data Visualization and Analysis
Infographic on Key Business Strategies and Metrics
Informative Graphic Representing Business KPIs and Marketing Strategies
Colorful Infographic on Marketing Concepts and Strategies
Infographic Elements Representing Marketing Metrics and Strategies
Comparison Infographic of Post Performance Metrics
Visual Representation of Key Performance Indicators for Marketing
Infographic on Marketing Strategies with Visual Icons
Positive Growth Indicator with Thumbs Up Symbol
Informative Graphic on Business Strategies and Metrics
Informative Graphic on Marketing Strategies and KPIs
Informative Graphic on Key Performance Indicators and Action Plans
Stylized 3D Bar Graph Showing Growth Trend
Data Visualization of User and Revenue Growth Metrics
Modern KPI Dashboard Displaying Performance Metrics
Performance Metrics Infographic with Key Indicators
E-commerce Marketing Infographic with Key Concepts
Stylized Financial Growth Chart with Dollar Coin
Informative Graphic on Marketing Strategies and KPIs
Infographic on SEO Strategies with Action Plan Elements
Healthcare Growth Chart with Medical Elements
Illustrative Diagram for Cybersecurity Planning and Metrics
Informative Infographic on Business Strategies and Metrics
3D Laptop with Rising Graph and Charts on Purple Background
Illustrative Graphic on Growth Metrics and Financial Trends
3D Web Design with Key Metrics Visualization
Modern Data Visualization Graphics on Transparent Panels
Dynamic Financial Chart with Rising Trends and Urban Background
Graphical Representation of Customer Needs Growth
Business Professional Analyzing Graphs and Charts
Illustration of a Person Engaging with Analytics Growth on Mobile
Modern Graph Icon Illustrating Growth and Progress
Futuristic Blue Abstract Background with Geometric Elements
Testimonial Social Media Post with User Feedback
Performance Growth Chart with Positive Feedback Symbol
Illustrative Graphic on Return on Investment Concepts
Infographic Highlighting Case Study Results with Graphical Elements
Stylish Blue Background with Geometric Shapes and Icons
Illustrative Diagram of Customer Feedback Loop Process
Visual Illustration of AI Integration in Marketing Strategies
Growth Chart with Rising Arrow Illustration
Business Performance Infographic with Graph and Happy Icon
Graphical Representation of Performance Metrics with Bold Typography
Dynamic Landing Page Design with 3D Elements
Minimalist Analytics Illustration with Graphs and Data
Customer Satisfaction Gauge Graphic with Engaging Design
Golden Coin with Indian Rupee Symbol on Growth Chart Background
Informative Graphic on Tracking Website Performance Metrics
Informative Graphic on Cybersecurity Metrics and Strategies
Case Study Results Visual with Graphs and Statistics
Minimalist Landing Page Design for Marketing Software
Customer Testimonial Graphic with Star Ratings
Customer Testimonials Graphic with Positive Feedback
Performance Meter Graphic with Thumbs Up Icon
Customer Review Illustration on Smartphone
Graphical Representation of Rating Improvement Strategies
Performance Gauge Graphic with Bold Typography
3D Landing Page Design with Coupons and Features
Customer Feedback Illustration with Smartphone and Reviews
Close-up of a Dart Hitting a Colorful Target Board
Dynamic Goal Tracker Board with 3D Elements and Gradient Background
Performance Gauge Graphic Indicating Metrics
Customer Satisfaction Gauge Graphic for Business Promotion
Vibrant Blue Background for Design Projects
Performance Meter Graphic with Bold Typography
Customer Testimonials Graphic Featuring Ratings
Cheerful Character Celebrating Achievement with Trophy and Graph
Case Study Results Highlighting Key Metrics
Customer Testimonial Graphic with Star Ratings
Stylized Growth Chart with Shield Icon for Business Insights
Modern Cloud Computing Concept with Data Upload Visuals
Stylized Graph with Growth Arrow and Feature Box
Boho Style Landing Page Design with Footer
Customer Testimonials Display with Star Ratings
Performance Gauge Icon with Bold Typography
Performance Gauge Graphic with Indicator
Customer Testimonials Graphic Featuring Positive Reviews
Customer Reviews Infographic Highlighting Company Benefits
Customer Satisfaction Infographic with Diverse Employee Representation
Email Marketing Performance Infographic Highlighting Key Metrics
Informative Graphic on Key Performance Indicators (KPIs)
Infographic on Employee Satisfaction and Productivity Benefits
Employee Satisfaction Infographic with Key Metrics
Informative Infographic on Campaign Performance Metrics
Influencer Marketing Performance Metrics Graphic
Infographic on Competitive Advantages in Business Strategy
Cloud Computing Infographic Highlighting Key Benefits
Infographic on Network Server Performance Metrics
Infographic on Influencer Marketing Performance Metrics
Results Infographic Highlighting Winning Strategies
Influencer Marketing Performance Data Visualization
Market Research Infographic Summary with Key Insights
Holiday Sales Analytics Infographic with Visual Elements
Business Audit Infographic with Key Performance Indicators
Illustrative Infographic on Rental Housing Market Insights
Informative Graphic on AI Integration and Key Performance Indicators
Infographic on Key Elements of Innovation
Data Analysis Infographic for Revenue Insights
Infographic on Influencer Marketing Performance Metrics
Informative Graphic on Customer Engagement Strategies
Marketing and Sales Strategy Graphic with Key Points
Financial Insights Dashboard for Analysis
Cloud Computing Infographic Highlighting Key Benefits
Modern Infographic on Cloud Computing Advantages
Informative Graphic on Cybersecurity Strategies
Informative Infographic on Plastic Waste Statistics
Influencer Marketing Performance Analysis Graphic
Data Visualization for Influencer Marketing Performance
Business Audit Infographic for Financial Strategy Insights
Infographic on Software Development Metrics with Illustrative Style
Cloud Computing Infographic with Visual Elements
Customer Feedback Transformation Graphic
Informative Graphic on Christmas Candle Statistics
Financial Growth Infographic Highlighting ROI
Infographic on Green Hydrogen Production
Startup Ideas Infographic with Data Visualization
Modern Graphic for Enterprise Solutions with Customization Theme
Infographic Highlighting Business Statistics with Rocket Theme
Informative Graphic on Solar Panel Installation Benefits
Customer Satisfaction Promotion Graphic with Engaging Metrics
Influencer Marketing Performance Graphic with Data Visualization
Promotional Graphic for Customer Satisfaction Strategies
Financial Planning Infographic Highlighting Tax Refund Benefits
Neighborhood Features Infographic with Iconography
Illustrative Guide for Referral Program Implementation
Holiday Insights Infographic with Statistics and Visual Elements
Internal Presentation Slide Design Example