Search
Sign In
2:3
2:3
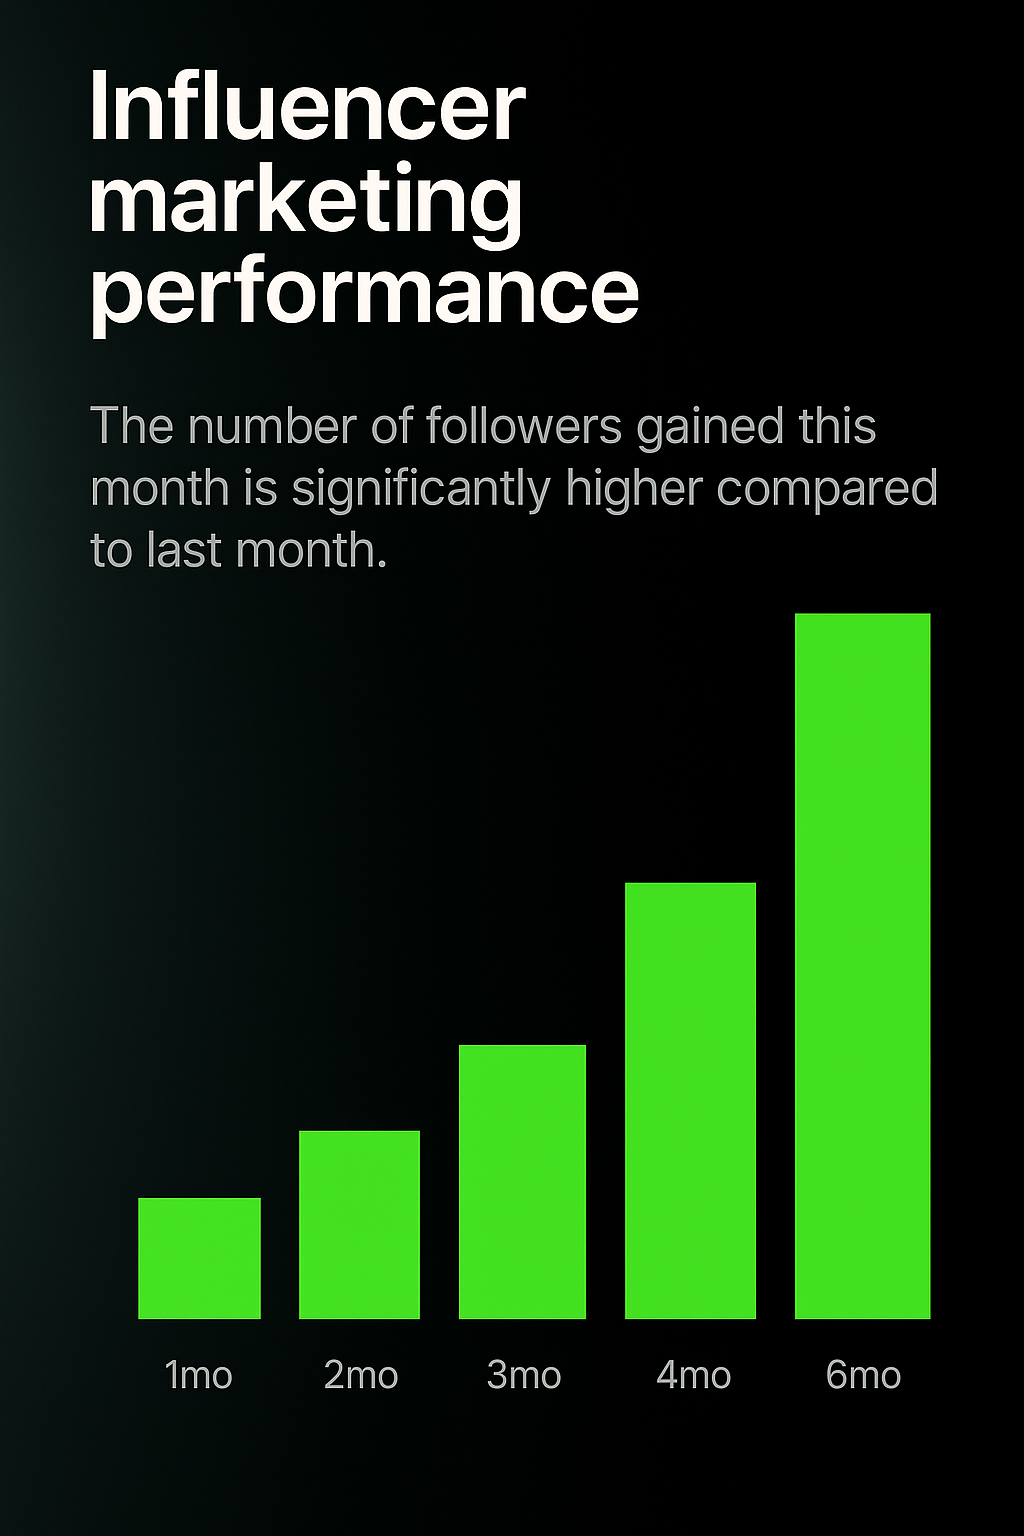
Data Visualization of Influencer Marketing Performance Over Time
/
Collection:
Basic Green
/
by davooda
/
Type: PNG
/
A sleek infographic showcasing the growth in followers over a six-month period, designed for marketing analysis and presentations.
Data Visualization for Influencer Marketing Performance
Influencer Marketing Performance Metrics Graphic
Infographic on Influencer Marketing Performance Metrics
Influencer Marketing Performance Data Visualization
Influencer Marketing Performance Analysis Graphic
Digital Marketing Performance Graphic with Data Visualization
Influencer Marketing Performance Graphic with Data Visualization
Influencer Marketing Performance Dashboard Illustration
Influencer Marketing Performance Analysis Graphic
Influencer Marketing Performance Report Graphic
Influencer Marketing Performance Analysis Graphic
Influencer Marketing Performance Graphic with Engaging Visuals
Data Visualization of User and Revenue Growth Metrics
Infographic on Influencer Marketing Strategies
User Demographics Bar Chart with Age Distribution
Informative Graphic on Influencer Marketing Strategies
Stylized Bar Graph with Upward Trend
Performance Metrics Infographic with Key Indicators
3D Chart Icon Representing Growth and Progress
Vibrant Social Media Marketing Promotional Graphic
Illustrative Graphic for Influencer Marketing Concept
Revenue Trend Graph Illustrating Audience Insights
3D Bar Chart Illustration Representing Growth
Infographic on Influencer Marketing Campaigns
Influencer Marketing Concept with Blue Hearts
3D Isometric Icon of a Growth Chart with Colorful Bars
KPI Performance Metrics Graphic for Business Analysis
Graphical Representation of Performance Metrics with Bold Typography
Stylized Bar Graph with Upward Arrow Representing Growth
3D Bar Chart Illustration Representing Growth
Social Media Post KPI Comparison Graphic
3D Bar Chart with Heart Icon for Data Visualization
Dynamic Marketing Message with Megaphone on Orange Background
3D Hand Holding Bar Graph with Upward Trend Arrow
3D Social Media Marketing Icon with Graph and Megaphone
Performance Gauge Graphic with Bold Typography
3D Bar Graph Illustration Representing Growth
Colorful Infographic on Influencer Marketing Strategies
Performance Gauge Icon with Bold Typography
Performance Growth Chart with Positive Feedback Symbol
Performance Meter Graphic with Thumbs Up Icon
Infographic Representing Gender Follower Distribution
Performance Meter Graphic Indicating Efficiency Level
Performance Gauge Icon with Minimalistic Design
Performance Meter Graphic with Bold Typography
Performance Gauge Graphic with Indicator
Illustrative Graphic on Influencer Marketing Analytics
Stylish 3D Upward Arrow Icon with Bars
Infographic on Social Media Usage by Age Group
3D Social Media Marketing Icon with Isometric Design
Influencer Marketing Concept with Heart Symbols
Infographic on Key Business Strategies and Metrics
Stylized Bar Chart Illustration for Data Visualization
Promotional Social Media Post for Influencer Marketing
Performance Meter Graphic Illustrating Measurement Concept
3D Bar Chart Icon Representing Growth Metrics
Informative Graphic on Marketing Strategies and KPIs
Marketing Performance Dashboard Graphic
Informative Graphic on Marketing Strategies and KPIs
3D Growth Icon with Chart and Person Representation
Informative Graphic on Key Performance Indicators (KPIs)
Stylized 3D Profit Icon with Coins and Graph
3D Graph Icon Representing Data Trends
3D Illustration of a Data Analysis Monitor with Graph
Colorful 3D Dollar Bar Graph Icon in Isometric View
Performance Gauge Graphic with Engaging Visual Elements
Performance Gauge Icon with Red and White Color Scheme
3D Heart Icons Representing Influencer Marketing Concept
Stylized Graphic Representing Key Performance Indicators
KPI Comparison Graphic with Smartphone Illustrations
Visual Representation of Key Performance Indicators for Marketing
3D Dollar Bar Graph Icon with Upward Trend
Illustration of a Person Engaging with Analytics Growth on Mobile
Engaging Social Media Promotion with Audience Growth Theme
3D Graph Icon Representing Growth and Progress
3D Money Growth Icon with Chart and Bag
Infographic on the Impact of Social Media Influencers
3D Dollar Bar Graph Icon with Isometric Design
3D Bar Graph Displaying Conversion Rates Over Four Months
Content Monetization Graphic with Earnings Overview
Stylized 3D ROI Icon with Graph and Dollar Symbol
Infographic Displaying KPI Progress Metrics with Visual Elements
Stylized Bar Chart Icon for Data Visualization
Performance Meter Graphic Indicating High Performance Level
Performance Gauge Graphic with Hand Interaction
3D Broker Icon with Graph Elements in Isometric View
Influence Marketing Concept with Heart Icons and Text
3D Illustration for Influencer Marketing Concept
3D Bar Chart Icon with Magnifying Glass in Isometric View
3D Growth Icon Depicting Progress with Arrows
3D Wealth Icon Featuring Money Bag and Growth Chart
Social Media Follower Milestone Graphic
Illustrative Graphic Representing Social Media Followers Count
Business Performance Infographic with Graph and Happy Icon
Illustrative Graphic on Audience Engagement in Social Media
3D Growth Icon Featuring Three People and an Upward Trend Line
3D Icon of a Growth Chart on Clipboard
Stylish 3D Upward Arrows Icon in Isometric View
Infographic on Audience Analysis for Influencer Engagement
Concert Audience Analysis Infographic
Live Concert Attendance Infographic with Statistics
Visual Representation of Social Media Engagement Metrics
Informative Infographic on Campaign Performance Metrics
Content Monetization Analytics Graphic
Comparison Infographic of Post Performance Metrics
Informative Graphic on Social Media Engagement
Digital Engagement Metrics Visualization with Energy Bars
Digital KPI Comparison Graphic for Social Media Posts
Informative Graphic on Influencer Marketing Strategies
Engagement Strategy Social Media Graphic
Case Study Results Highlighting Key Metrics
Concert Attendance Data Infographic with Visual Statistics
Traffic Analysis Infographic with Growth Metrics
Interactive Data Dashboard Promotional Graphic
Informative Trading Strategy Graphic for Investors
Visual Representation of Social Media Engagement Metrics
Email Marketing Performance Infographic Highlighting Key Metrics
Professional Board Presentation Tips Visual Guide
Social Media Engagement Promotion Graphic
Engaging Research Summary Graphic Highlighting Key Statistic
Visual Representation of Charts and Data Overview
Infographic on Plastic Waste and Recycling Statistics
Informative Graphic on Social Media Algorithms for Engagement
Infographic on Pickleball Participation and Growth Statistics
Dynamic Graphic Promoting Growth and Engagement
Informative Graphic on Key Performance Indicators and Action Plans
Promotional Graphic for Influencer Marketing Collaboration
Social Media Content Planning Graphic
Informative Graphic on Tracking Website Performance Metrics
Infographic on Researching Viral Video Trends
Graph Displaying User Growth and Adoption Trends
Dynamic Visual on AI Transformation and Innovation
Colorful Illustration Explaining Influencer Marketing Concept
YouTube Analytics Visualization for Performance Tracking
Infographic on Global Plastic Waste Statistics and Impact
Illustrative Graphic on Influencer Verification Benefits
Infographic Highlighting Key Performance Indicators (KPIs)
Informative Infographic on Plastic Waste Statistics
Digital Exchange Platform Promotional Graphic with Data Visualization
Dynamic Data Visualization for Business Process Automation
Modern Graphic Design for Video Engagement Tips
Informative Graphic on Solar Panel Installation Growth
Concert Stage Overview Infographic with Audience Metrics
KPI Infographic for Data Visualization and Analysis
Engaging Social Media Post on Alerts and Notifications
Audience Interests Infographic with Data Visualization
Marketing Graphic Promoting Customer Growth Through Relationships
Interactive Social Media Engagement Graphic