System maintenance in progress
System maintenance
- Some features may be temporarily unavailable.
Search
Sign In
Edit in Shortodella
Auto
2:3
Edit in Shortodella
Auto
2:3
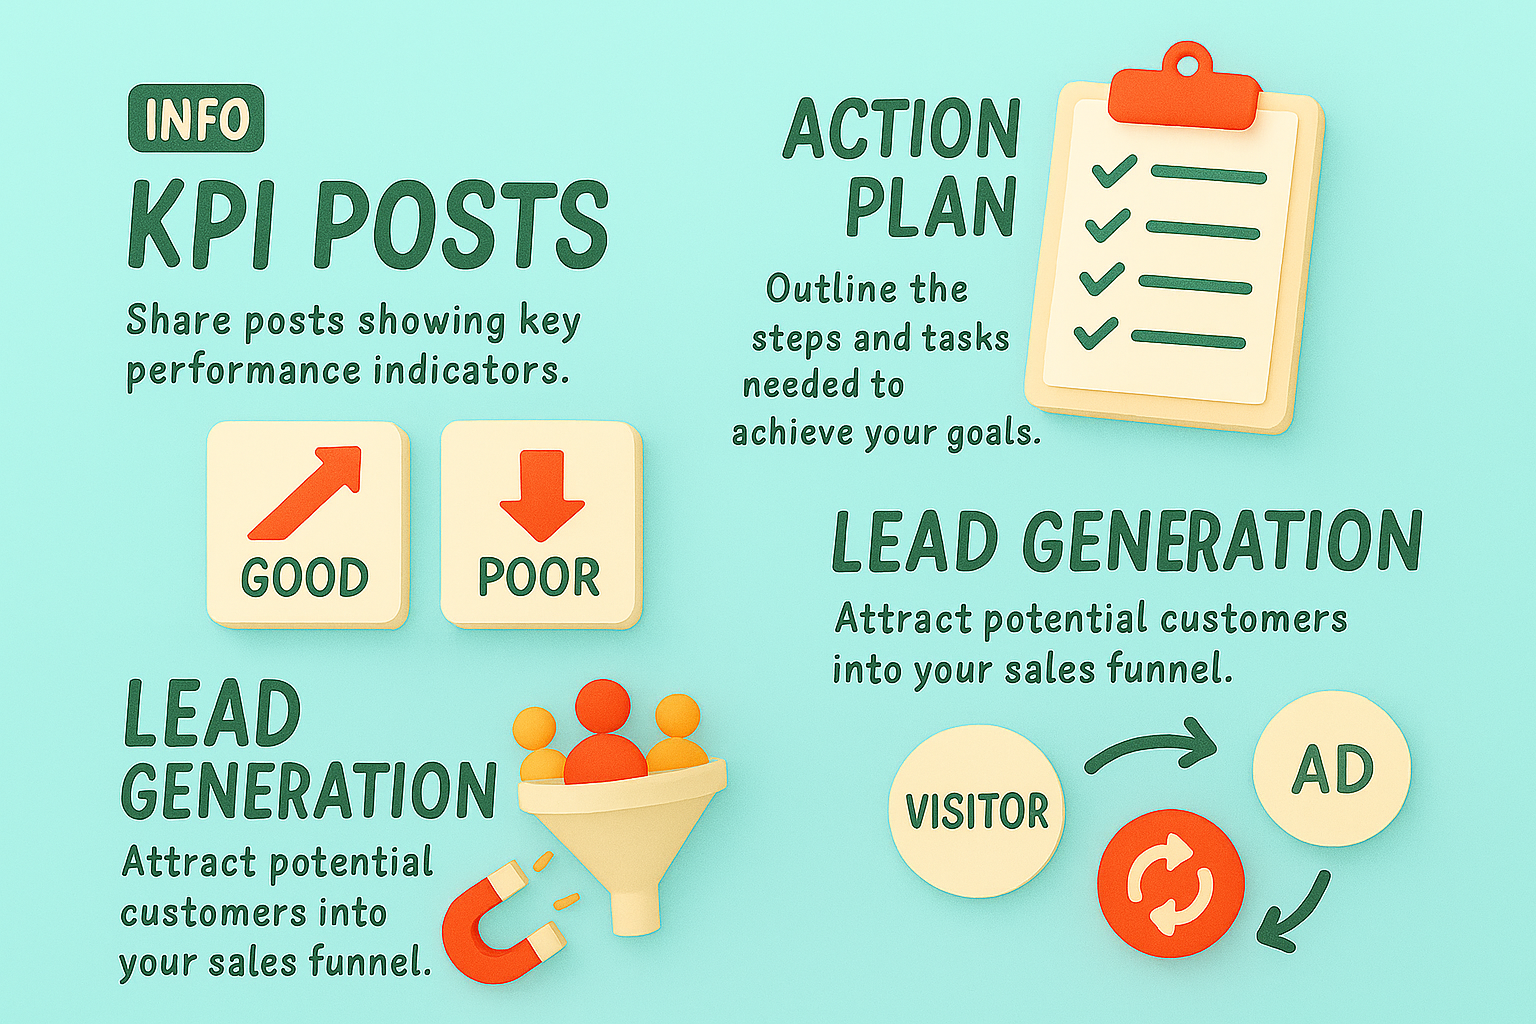
Informative Graphic on KPI Posts and Lead Generation
/
Free
/
Collection:
Let's Present
/
by davooda
/
Type: PNG
/
Colorful infographic detailing key performance indicators and lead generation strategies, ideal for marketing presentations or social media.
Informative Graphic on Post KPIs and Performance Measurement
Informative Graphic on Marketing Strategies and KPIs
Informative KPI Graphic for Business Metrics
Informative Graphic on Key Performance Indicators (KPIs)
Colorful Infographic Illustrating Business Performance Metrics
Informative Graphic on Key Performance Indicators (KPIs)
Informative Infographic on Business Strategies and Metrics
Infographic on Key Business Strategies and Metrics
Illustrative Infographic on Key Performance Indicators (KPI)
Colorful Infographic on Marketing Concepts and Strategies
Informative Graphic on Business Strategies and Metrics
KPI Performance Metrics Graphic for Business Analysis
Marketing Performance Dashboard Graphic
Infographic Highlighting Key Performance Indicators (KPIs)
Informative Graphic on Marketing Strategies and KPIs
Informative Graphic on Key Performance Indicators and Action Plans
KPI Infographic for Data Visualization and Analysis
Colorful Infographic Representing KPI and Action Plan Concepts
Social Media Post KPI Comparison Graphic
Stylized Graphic Representing Key Performance Indicators
KPI Comparison Graphic with Smartphone Illustrations
Infographic on Marketing Strategies with Visual Icons
Informative Graphic on Key Performance Indicators
Informative Graphic on Marketing Strategies and KPIs
Illustrative Diagram for Cybersecurity Planning and Metrics
Infographic Displaying KPI Progress Metrics with Visual Elements
Digital KPI Comparison Graphic for Social Media Posts
Informative Graphic on KPI Metrics for Performance Evaluation
Informative Graphic Representing Business KPIs and Marketing Strategies
Infographic Elements Representing Marketing Metrics and Strategies
E-commerce Marketing Infographic with Key Concepts
KPI Infographic with Performance Metrics and Graphs
Informational Graphic on Web Metrics and Strategies
Comparison Infographic of Post Performance Metrics
Visual Representation of Social Media Engagement Metrics
Visual Representation of Key Performance Indicators for Marketing
Infographic on SEO Strategies with Action Plan Elements
3D Infographic on Conversion Rate Calculation
Performance Metrics Infographic with Key Indicators
KPI Post Comparison Graphic with Illustrated Tablets
Sales Funnel Infographic Illustrating Customer Journey
Business Strategy Infographic Highlighting Key Metrics and Actions
Visual Illustration of AI Integration in Marketing Strategies
Informative Graphic on Key Performance Indicators (KPIs)
Informative Graphic on Tracking Website Performance Metrics
Influencer Marketing Performance Report Graphic
3D Illustration on Content Marketing Strategy
Illustrative Action Plan Infographic for Goal Setting
Colorful Informational Graphic on Marketing Concepts
Performance Growth Chart with Positive Feedback Symbol
Creative Graphic on Hashtag Content Strategy
Lead Generation Concept Graphic with Funnel and Icons
Stylized 3D Bar Graph Showing Growth Trend
Conceptual Illustration of Lead Nurturing with Plant Motif
Infographic on Influencer Marketing Performance Metrics
Informative Graphic on Cybersecurity Strategies
Informative Infographic on Campaign Performance Metrics
Colorful Educational Graphics for Digital Marketing Concepts
Engaging Digital Marketing Infographic on Call to Action Strategies
Infographic on Influencer Marketing Performance Metrics
Influencer Marketing Performance Dashboard Illustration
Informative Graphic on Cybersecurity Metrics and Strategies
Dynamic Goal Tracker Board with 3D Elements and Gradient Background
Positive Growth Indicator with Thumbs Up Symbol
Illustrative Graphic on Influencer Marketing Analytics
Infographic Illustrating Action Steps for Project Management
Digital Marketing Performance Graphic with Data Visualization
Stylized Graph Showing Financial Growth with Dollar Coin
Illustrative Graphic on Return on Investment Concepts
Lead Targeting Concept Graphic with Magnifying Glass
3D Laptop with Rising Graph and Charts on Purple Background
3D Illustration of Conversion Funnel Concept
Vibrant Social Media Marketing Promotional Graphic
Graphical Representation of Customer Needs Growth
Influencer Marketing Performance Graphic with Data Visualization
Influencer Marketing Performance Analysis Graphic
Colorful Infographic Design Illustrating Data Visualization Concepts
Modern Data Visualization Graphics on Transparent Panels
Infographic on Audience Analysis for Influencer Engagement
Stylized Financial Growth Chart with Dollar Coin
Dynamic Marketing Message with Megaphone on Orange Background
Dynamic Business Meeting with Team Collaboration and Strategy Planning
Data Visualization for Influencer Marketing Performance
Healthcare Growth Chart with Medical Elements
Playful Graphic on Content Creation Strategies
Influencer Marketing Performance Analysis Graphic
User Engagement Concept Illustration with Social Media Icons
Infographic on Content Monetization Strategies
3D Visual Progress Tracker Design for Web Page
Graphical Representation of Performance Metrics with Bold Typography
Illustrative Action Plan Infographic with Clear Steps
Business Performance Infographic with Graph and Happy Icon
Minimalist Analytics Illustration with Graphs and Data
Growth Chart with Rising Arrow Illustration
Performance Growth Chart with Positive Feedback
Informative Graphic on AI Integration and Key Performance Indicators
Performance Meter Graphic with Thumbs Up Icon
Stylish Blue Background with Geometric Shapes and Icons
Dynamic Marketing Message with Megaphone on Orange Background
Influencer Marketing Performance Metrics Graphic
Infographic on Key Elements of Innovation
Email Marketing Performance Infographic Highlighting Key Metrics
Marketing and Sales Strategy Graphic with Key Points
Informative Graphic on Digital Marketing Strategies
Informative Graphic on Trends for Viral Video Content
Influencer Marketing Performance Data Visualization
Informative Graphic on Solar Panel Installation Benefits
Informative Graphic on Influencer Marketing Strategies
Engaging Research Summary Graphic Highlighting Key Statistic
Informative Graphic on Social Media Algorithms for Engagement
Startup Ideas Infographic with Data Visualization
Informative Graphic on Social Media Engagement
Informative Graphic on Customer Engagement Strategies
Infographic on Influencer Marketing Strategies
Colorful Infographic on Digital Marketing Strategies
Traffic Analysis Infographic with Growth Metrics
Informative Graphic on Sustainable Energy Sources
Infographic Highlighting Startup Ideas with Market Potential
Promotional Graphic for Solar Energy Benefits
Infographic on Competitive Advantages in Business Strategy
Infographic Highlighting Case Study Results with Graphical Elements
Results Infographic Highlighting Winning Strategies
Professional Board Presentation Tips Visual Guide
Visual Representation of Charts and Data Overview
Modern Information Technology Graphic with Key Focus Areas
Customer Reviews Infographic Highlighting Company Benefits
Professional Data Presentation and Evaluation Graphic
Digital Engagement Infographic with Energy Bars Concept
Neighborhood Exploration Infographic with Icons
Informative Infographic About the Sun's Characteristics
Informative Graphic on Influencer Marketing Strategies
Informative Graphic on Energy Efficiency with Heat Pumps
Neighborhood Features Infographic with Icons and Text
Infographic on Employee Satisfaction and Productivity Benefits
Informative Graphic on Supporting Green Energy Initiatives
Professional Business Growth Strategies with Engaging Visuals
Informative Graphic on Cannabis Basics and Effects
Informative Graphic on Oil and Gas Pipelines
Productivity Tips Graphic for Modern Office Environment
Promotional Spa Services Infographic Highlighting Key Features
Visual Guide to the Infographic Design Process
Colorful Infographic Design with Data Visualization Elements
Market Research Infographic Summary with Key Insights
Internal Presentation Slide Design Example
Infographic on Production Efficiency in Manufacturing
Informative Product Features Graphic with Icons
Informative Graphic on Senior Care Tips for Older Adults
Infographic on Green Hydrogen Production
Professional Presentation Slide with Key Points and Visual Data
Infographic on Energy Usage Reduction with Visual Statistics