System maintenance in progress
System maintenance
- Some features may be temporarily unavailable.
Search
Sign In
Edit in Shortodella
Auto
2:3
Edit in Shortodella
Auto
2:3
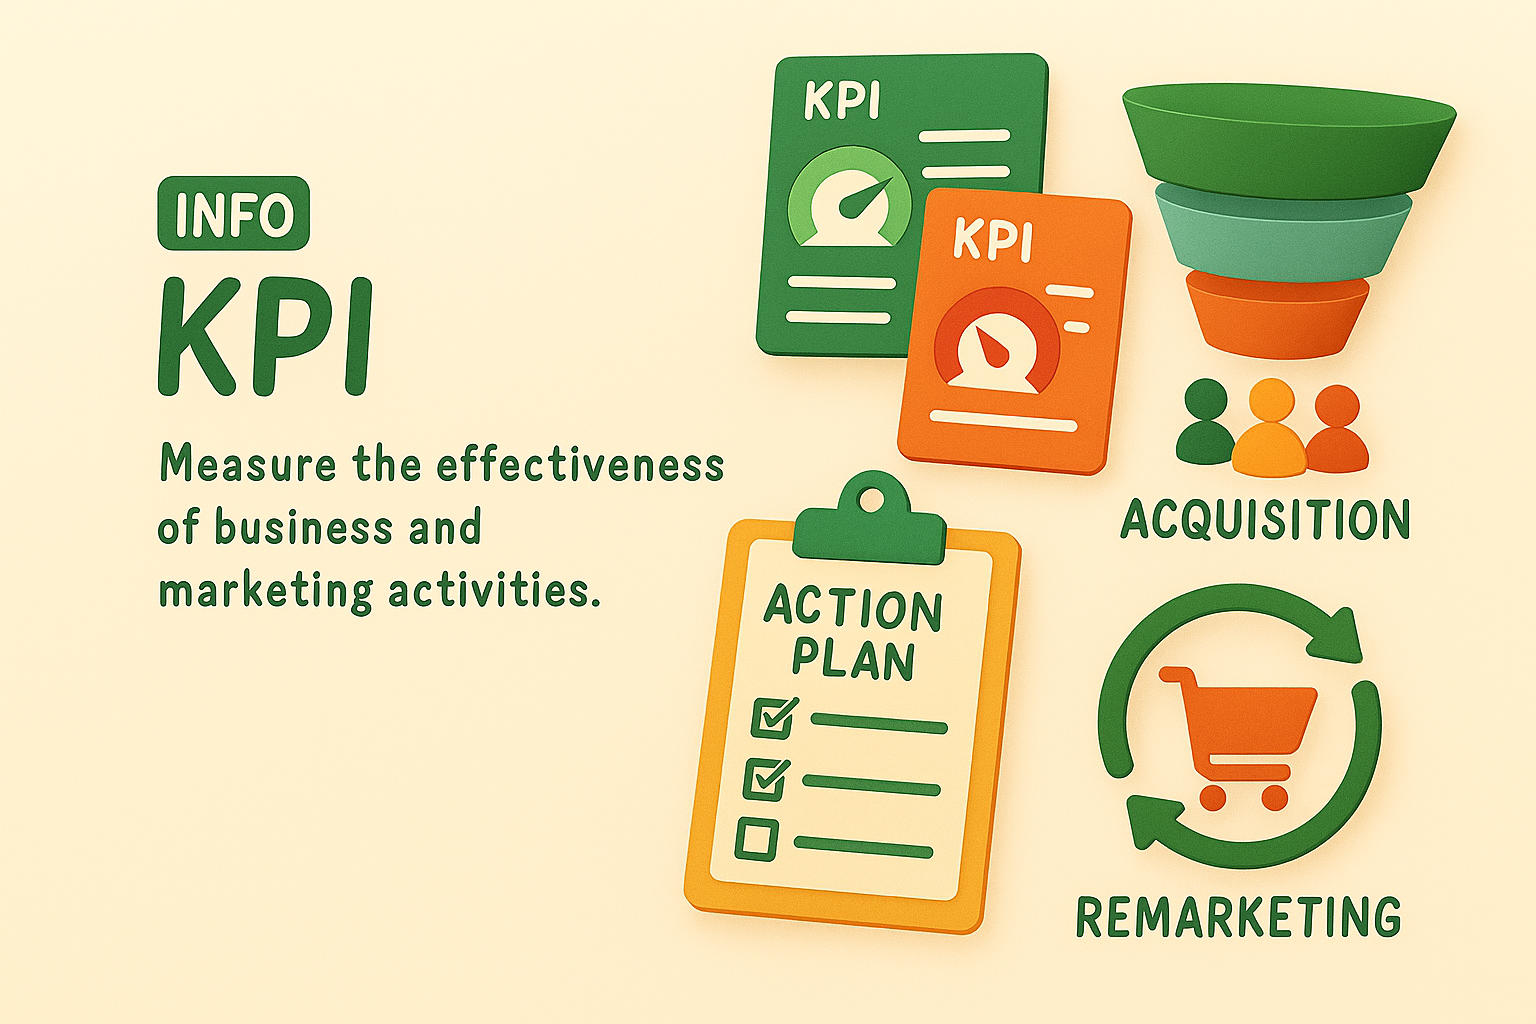
Informative Graphic Representing Business KPIs and Marketing Strategies
/
Free
/
Collection:
Let's Present
/
by davooda
/
Type: PNG
/
Colorful infographic illustrating key performance indicators (KPIs), acquisition strategies, and remarketing plans. Ideal for business presentations and marketing materials.
Informative KPI Graphic for Business Metrics
Colorful Infographic Representing KPI and Action Plan Concepts
Informative Graphic on Key Performance Indicators (KPIs)
Informative Graphic on Marketing Strategies and KPIs
Informative Graphic on Key Performance Indicators and Action Plans
Informative Graphic on Key Performance Indicators
Colorful Infographic on Marketing Concepts and Strategies
Informative Graphic on Key Performance Indicators (KPIs)
Colorful Infographic Illustrating Business Performance Metrics
Infographic Elements Representing Marketing Metrics and Strategies
Infographic Displaying KPI Progress Metrics with Visual Elements
Illustrative Infographic on Key Performance Indicators (KPI)
Informative Graphic on Business Strategies and Metrics
Marketing Performance Dashboard Graphic
Infographic Highlighting Key Performance Indicators (KPIs)
Infographic on Key Business Strategies and Metrics
Informative Graphic on Marketing Strategies and KPIs
Informative Graphic on Marketing Strategies and KPIs
Informative Graphic on Post KPIs and Performance Measurement
E-commerce Marketing Infographic with Key Concepts
Informative Graphic on KPI Metrics for Performance Evaluation
Informative Infographic on Business Strategies and Metrics
Business Strategy Infographic Highlighting Key Metrics and Actions
Informative Graphic on KPI Posts and Lead Generation
Infographic on Marketing Strategies with Visual Icons
KPI Infographic for Data Visualization and Analysis
Informational Graphic on Web Metrics and Strategies
Informative Infographic on Campaign Performance Metrics
KPI Performance Metrics Graphic for Business Analysis
Informative Graphic on Tracking Website Performance Metrics
KPI Comparison Graphic with Smartphone Illustrations
KPI Infographic with Performance Metrics and Graphs
Informative Graphic on Cybersecurity Metrics and Strategies
Visual Representation of Key Performance Indicators for Marketing
3D Illustration on Content Marketing Strategy
Informative Graphic on Key Performance Indicators (KPIs)
Stylized Graphic Representing Key Performance Indicators
Illustrative Graphic on Return on Investment Concepts
Infographic on SEO Strategies with Action Plan Elements
Performance Metrics Infographic with Key Indicators
Visual Illustration of AI Integration in Marketing Strategies
Modern KPI Dashboard Displaying Performance Metrics
3D Infographic on Conversion Rate Calculation
Landing Page Design for Marketing Strategies and Features
Colorful Educational Graphics for Digital Marketing Concepts
Social Media Post KPI Comparison Graphic
Illustrative Diagram for Cybersecurity Planning and Metrics
Dynamic Marketing Message with Megaphone on Orange Background
Graphical Representation of Business Intelligence Concepts
Illustrative Action Plan Infographic for Goal Setting
Positive Growth Indicator with Thumbs Up Symbol
Colorful Informational Graphic on Marketing Concepts
Informative Graphic on Cybersecurity Strategies
3D Red Arrow Icon Illustrating Marketing Performance Metrics
User Engagement Concept Illustration with Social Media Icons
Email Marketing Concept Graphic with Engaging Visuals
Digital KPI Comparison Graphic for Social Media Posts
Minimalist Analytics Illustration with Graphs and Data
3D Web Design with Key Metrics Visualization
Informative Graphic on AI Integration and Key Performance Indicators
Data Analytics Promotional Graphic with Modern Design Elements
Data Visualization of User and Revenue Growth Metrics
Business Professional Analyzing Graphs and Charts
3D Illustration of Conversion Funnel Concept
Sales Funnel Infographic Illustrating Customer Journey
Futuristic Blue Abstract Background with Geometric Elements
Creative Business Planning Concept with Sticky Notes
Visual Representation of Social Media Engagement Metrics
Illustrative Graphic on Influencer Marketing Analytics
Colorful Infographic Design Illustrating Data Visualization Concepts
Marketing and Sales Strategy Graphic with Key Points
Infographic Illustration of the AIDA Marketing Funnel
3D Scene of Analytics Segment with Miniature Figures
Performance Growth Chart with Positive Feedback Symbol
Pathway to Success: 3D Mountain Illustration with Performance Tracking
Data Analytics Illustration with Graphs and Percentages
Digital Marketing Concept with 3D Elements
Business Analytics Concept with KPI Dashboard Visuals
Dynamic Business Meeting with Team Collaboration and Strategy Planning
Illustrative Graphic on Growth Metrics and Financial Trends
3D Illustration of Channel Growth Metrics on a Computer Screen
Infographic Illustrating Action Steps for Project Management
Modern Information Design: Data Usage Visualization
KPI Post Comparison Graphic with Illustrated Tablets
Infographic on Content Monetization Strategies
Colorful Infographic Design with Data Visualization Elements
Stylized 3D Bar Graph Showing Growth Trend
Informative Graphic on Digital Marketing Strategies
3D Illustration of a Gas Pump with Informative Block
Colorful Infographic on Influencer Marketing Strategies
Modern Data Visualization Graphics on Transparent Panels
Effective Advertising Landing Page Design for Better Results
Influencer Marketing Performance Report Graphic
Engaging Digital Marketing Infographic on Call to Action Strategies
YouTube Analytics Visualization for Performance Tracking
3D Laptop with Rising Graph and Charts on Purple Background
Dynamic Business Meeting with Team Collaboration on Strategy
Dynamic Marketing Message with Megaphone on Orange Background
SEO Marketing Promotion with Mobile Device Visuals
Infographic on Influencer Marketing Performance Metrics
Business Audit Infographic with Key Performance Indicators
Informative Graphic on Influencer Marketing Strategies
Email Marketing Performance Infographic Highlighting Key Metrics
Business Audit Infographic for Financial Strategy Insights
Market Analysis Graphic with Data Visualization
Illustrative Infographic on Rental Housing Market Insights
Influencer Marketing Performance Data Visualization
Colorful Infographic on Digital Marketing Strategies
Influencer Marketing Performance Metrics Graphic
Infographic on Key Elements of Innovation
Informative Product Features Graphic with Icons
Content Monetization Analytics Graphic
Informative Graphic on Trends for Viral Video Content
Customer Reviews Infographic Highlighting Company Benefits
Infographic on Audience Analysis for Influencer Engagement
Market Research Infographic Summary with Key Insights
Service Offerings Graphic with Icons and Text
Content Monetization Graphic with Earnings Overview
Colorful Pears with Antioxidant Benefits - Informative Graphic
Infographic on Influencer Marketing Performance Metrics
Illustrative Guide for Referral Program Implementation
Infographic on Competitive Advantages in Business Strategy
Holiday Sales Analytics Infographic with Visual Elements
Service Offerings Graphic Featuring Digital Solutions
Influencer Marketing Performance Analysis Graphic
Influencer Marketing Performance Graphic with Data Visualization
Traffic Analysis Infographic with Growth Metrics
Professional Business Growth Strategies with Engaging Visuals
Business Planning Concept Graphic for Strategic Development
Holiday Insights Infographic with Statistics and Visual Elements
Influencer Marketing Performance Analysis Graphic
Informative Graphic on Gas Fees with Illustrative Elements
Informative Graphic on Investing Tips for Beginners
Informative Graphic on Rental Housing Market Dynamics
Data Analysis for Startups: Enhancing Sales and Profits
Informative Health Graphic on Heart Palpitations
Graphical Representation of Rating Improvement Strategies
Infographic Highlighting Startup Ideas with Market Potential
Financial Dashboard Visualization with Data Insights
Professional Data Presentation and Evaluation Graphic
Informative Graphic on Social Media Algorithms for Engagement
Data Analysis Infographic for Revenue Insights
Stock Market Analysis Graphic Featuring Trading Strategies
Content Monetization Tips Graphic with Illustrative Elements
Illustrative Graphic on Content Monetization Strategies
Real Estate Promotion Graphic Featuring Neighborhood Amenities
Business Performance Analysis Graphic with Trend Chart
Infographic on Pickleball Participation and Growth Statistics
Financial Insights Dashboard for Analysis
Neighborhood Exploration Infographic with Icons