System maintenance in progress
System maintenance
- Some features may be temporarily unavailable.
Search
Sign In
Edit in Shortodella
Auto
2:3
Edit in Shortodella
Auto
2:3
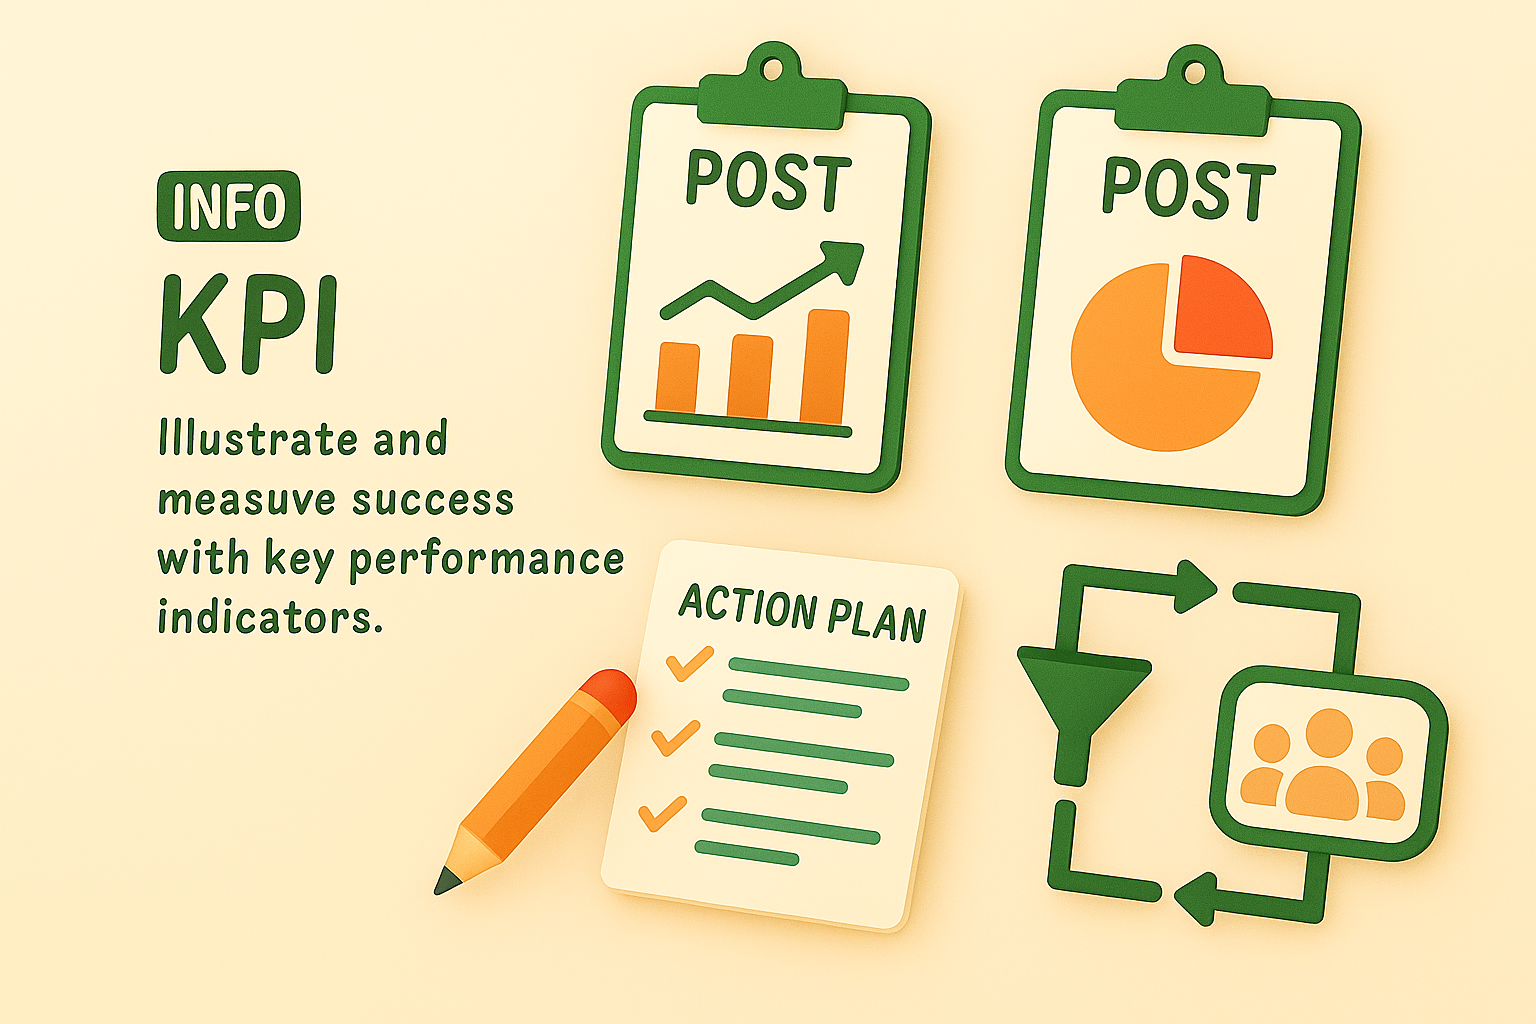
Illustrative Infographic on Key Performance Indicators (KPI)
/
Free
/
Collection:
Let's Present
/
by davooda
/
Type: PNG
/
Informative infographic depicting key performance indicators, featuring charts and action plans. Ideal for business presentations and strategy discussions.
Informative Graphic on Key Performance Indicators (KPIs)
Informative Graphic on Key Performance Indicators
Informative KPI Graphic for Business Metrics
Informative Graphic on Key Performance Indicators and Action Plans
Informative Graphic on Key Performance Indicators (KPIs)
Informative Graphic on Post KPIs and Performance Measurement
Informative Graphic on KPI Posts and Lead Generation
KPI Infographic for Data Visualization and Analysis
Stylized Graphic Representing Key Performance Indicators
Colorful Infographic Representing KPI and Action Plan Concepts
Infographic Highlighting Key Performance Indicators (KPIs)
Informative Graphic on KPI Metrics for Performance Evaluation
Marketing Performance Dashboard Graphic
Colorful Infographic on Marketing Concepts and Strategies
Informative Graphic Representing Business KPIs and Marketing Strategies
Infographic Displaying KPI Progress Metrics with Visual Elements
Colorful Infographic Illustrating Business Performance Metrics
Informative Graphic on Marketing Strategies and KPIs
KPI Performance Metrics Graphic for Business Analysis
Informative Graphic on Marketing Strategies and KPIs
KPI Infographic with Performance Metrics and Graphs
Visual Representation of Key Performance Indicators for Marketing
KPI Comparison Graphic with Smartphone Illustrations
Illustrative Diagram for Cybersecurity Planning and Metrics
Informative Graphic on Business Strategies and Metrics
Social Media Post KPI Comparison Graphic
Informative Infographic on Business Strategies and Metrics
Performance Growth Chart with Positive Feedback Symbol
Informative Graphic on Tracking Website Performance Metrics
Informative Graphic on Cybersecurity Metrics and Strategies
Infographic on Key Business Strategies and Metrics
Visual Representation of Social Media Engagement Metrics
Business Strategy Infographic Highlighting Key Metrics and Actions
Infographic on SEO Strategies with Action Plan Elements
Informational Graphic on Web Metrics and Strategies
Digital KPI Comparison Graphic for Social Media Posts
Infographic on Marketing Strategies with Visual Icons
Infographic Elements Representing Marketing Metrics and Strategies
E-commerce Marketing Infographic with Key Concepts
KPI Post Comparison Graphic with Illustrated Tablets
Performance Metrics Infographic with Key Indicators
Informative Graphic on Cybersecurity Strategies
Informative Graphic on Key Performance Indicators (KPIs)
Performance Meter Graphic with Thumbs Up Icon
Illustrative Action Plan Infographic for Goal Setting
3D Icon Representing OKR Framework with Target and Graph
3D Document Icon with Graphs and Pencil Design
3D Icon of a Growth Chart on Clipboard
Business Performance Infographic with Graph and Happy Icon
Stylized 3D Financial Chart Icon for Analysis
Stylish 3D Limit-Order Icon with Graph and Checkmarks
3D Web Design with Key Metrics Visualization
3D Graph Icon with Magnifying Glass for Analysis
Stylish 3D Data Analytics Icon in Isometric View
Informative Infographic on Campaign Performance Metrics
3D Financial Chart Icon with Graph and Magnifying Glass
Performance Gauge Graphic Indicating Metrics
Performance Gauge Graphic with Bold Typography
Performance Indicator Graphic with Gauge and Thumbs Up
Performance Gauge Graphic with Indicator
3D Graph Presentation on Flip Chart
Graphical Representation of Performance Metrics with Bold Typography
Infographic Illustrating Action Steps for Project Management
3D Bar Chart Icon with Magnifying Glass in Isometric View
3D Magnifying Glass Over Graph Icon for Data Analysis
Comparison Infographic of Post Performance Metrics
Performance Indicator Graphic with Hand and Gauge
Performance Growth Chart with Positive Feedback
3D Financial Chart Icon with Analysis Elements
Performance Gauge Icon with Bold Typography
Stylish 3D Document Icons with Graphs and Plus Sign
3D Bar Chart Illustration Representing Growth
Performance Gauge Graphic with Engaging Visual Elements
Performance Measurement Graphic with Gauge Illustration
Performance Meter Graphic Indicating Efficiency Level
3D Benefit Icon Illustrating Growth and Success
3D Bar Chart Icon with Magnifying Glass in Isometric View
Performance Meter Graphic with Bold Typography
3D Appraisal Icon with Checkmark and Graph
3D Blueprint Design with Pencil and Charts
Performance Gauge Illustration with Clear Indicators
3D Illustration of a Data Analysis Monitor with Graph
3D Bar Chart Illustration Representing Growth
Colorful Strategy Planning Clipboard Icon
3D Render of a Presentation Board with Pie Chart
Performance Gauge Graphic with Bold Typography
Performance Gauge Icon with Red and White Color Scheme
3D Magnifying Glass Over Line Graph Icon
3D Bar Chart Icon Representing Growth Metrics
Colorful 3D Isometric Chart Icon on Transparent Background
Stylized 3D Chart Icon for Document Visualization
3D Graph Analysis Icon with Magnifying Glass on Transparent Background
Performance Meter Graphic Illustrating Measurement Concept
3D Chart Icon Representing Growth and Progress
3D Growth Icon with Colorful Bars and Plant
3D Graph Icon Representing Data Trends
3D Data Analysis Icon with Magnifying Glass
Stylish 3D Isometric Icon for Presentation Decks
3D Bar Graph Icon with Presentation Board
Business Audit Infographic with Key Performance Indicators
Email Marketing Performance Infographic Highlighting Key Metrics
Informative Graphic on AI Integration and Key Performance Indicators
Professional Data Presentation and Evaluation Graphic
Customer Reviews Infographic Highlighting Company Benefits
Business Audit Infographic for Financial Strategy Insights
Infographic Highlighting Business Statistics with Rocket Theme
Business Analytics Concept with KPI Dashboard Visuals
Conference Attendance Infographic with Key Statistics
Infographic on Key Elements of Innovation
Infographic on Software Development Metrics with Illustrative Style
Infographic on Influencer Marketing Performance Metrics
Results Infographic Highlighting Winning Strategies
Customer Satisfaction Infographic with Diverse Employee Representation
Illustrative Graphic on Growth Metrics and Financial Trends
Employee Satisfaction Infographic with Key Metrics
Market Analysis Graphic with Data Visualization
Infographic on Network Server Performance Metrics
Informative Infographic on Plastic Waste Statistics
Infographic on Influencer Marketing Performance Metrics
Colorful Infographic Design Illustrating Data Visualization Concepts
Infographic on Production Efficiency in Manufacturing
Informative Graphic on Christmas Candle Statistics
Neighborhood Features Infographic with Icons and Text
Cloud Computing Infographic with Visual Elements
Startup Ideas Infographic with Data Visualization
Illustrative Infographic on Renewable Energy Solutions
Infographic on Employee Satisfaction and Productivity Benefits
Infographic on Competitive Advantages in Business Strategy
Employee Benefits Infographic with Iconography
Infographic Highlighting Case Study Results with Graphical Elements
Traffic Analysis Infographic with Growth Metrics
Internal Presentation Slide Design Example
Infographic on Wheat Sales Growth with Visual Elements
Financial Growth Infographic with Investment Insights
Infographic on Green Hydrogen Production
Illustrative Graphic on Return on Investment Concepts
Graphical Representation of Rating Improvement Strategies
Influencer Marketing Performance Metrics Graphic
Influencer Marketing Performance Data Visualization
Financial Insights Dashboard for Analysis
Illustrative Infographic on Rental Housing Market Insights
Market Analysis Infographic with Data Highlights
Interactive Data Dashboard Promotional Graphic
Data Analysis Infographic for Revenue Insights
Informative Product Features Graphic with Icons
Visual Representation of Charts and Data Overview
Professional Presentation Slide on Internal Communication Metrics
Holiday Sales Analytics Infographic with Visual Elements
Financial Dashboard Visualization with Data Insights