System maintenance in progress
System maintenance
- Some features may be temporarily unavailable.
Search
Sign In
Edit in Shortodella
Auto
2:3
Edit in Shortodella
Auto
2:3
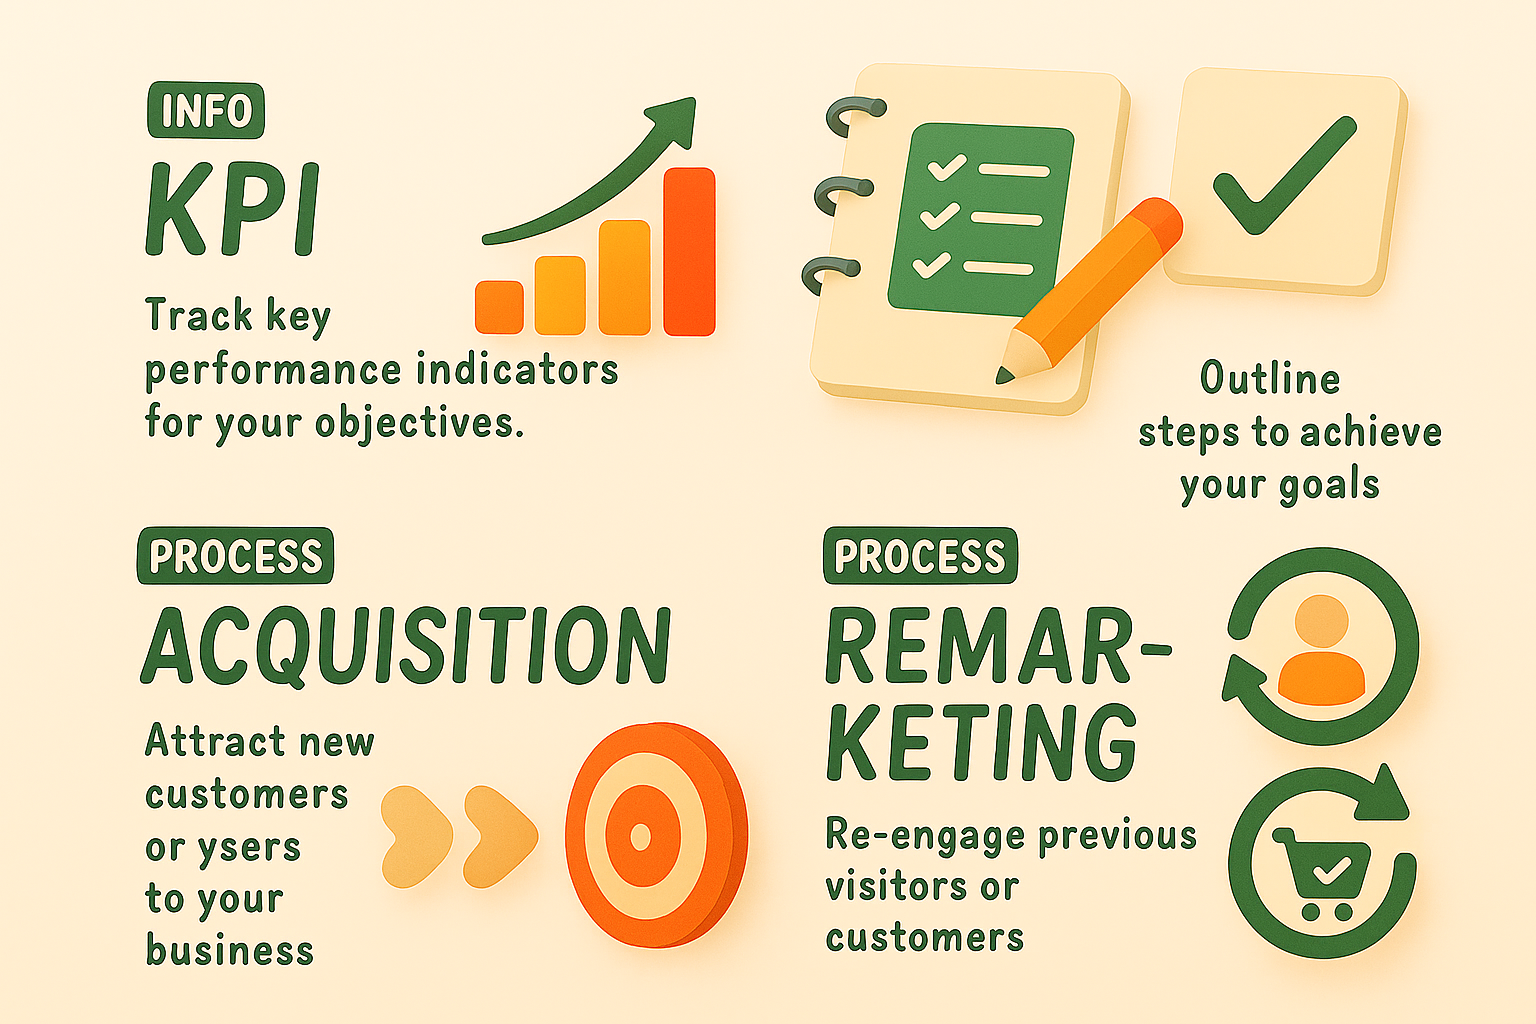
Informative Graphic on Marketing Strategies and KPIs
/
Free
/
Collection:
Let's Present
/
by davooda
/
Type: PNG
/
Illustrative infographic detailing key performance indicators and marketing processes, utilizing vibrant colors and icons to engage the audience effectively.