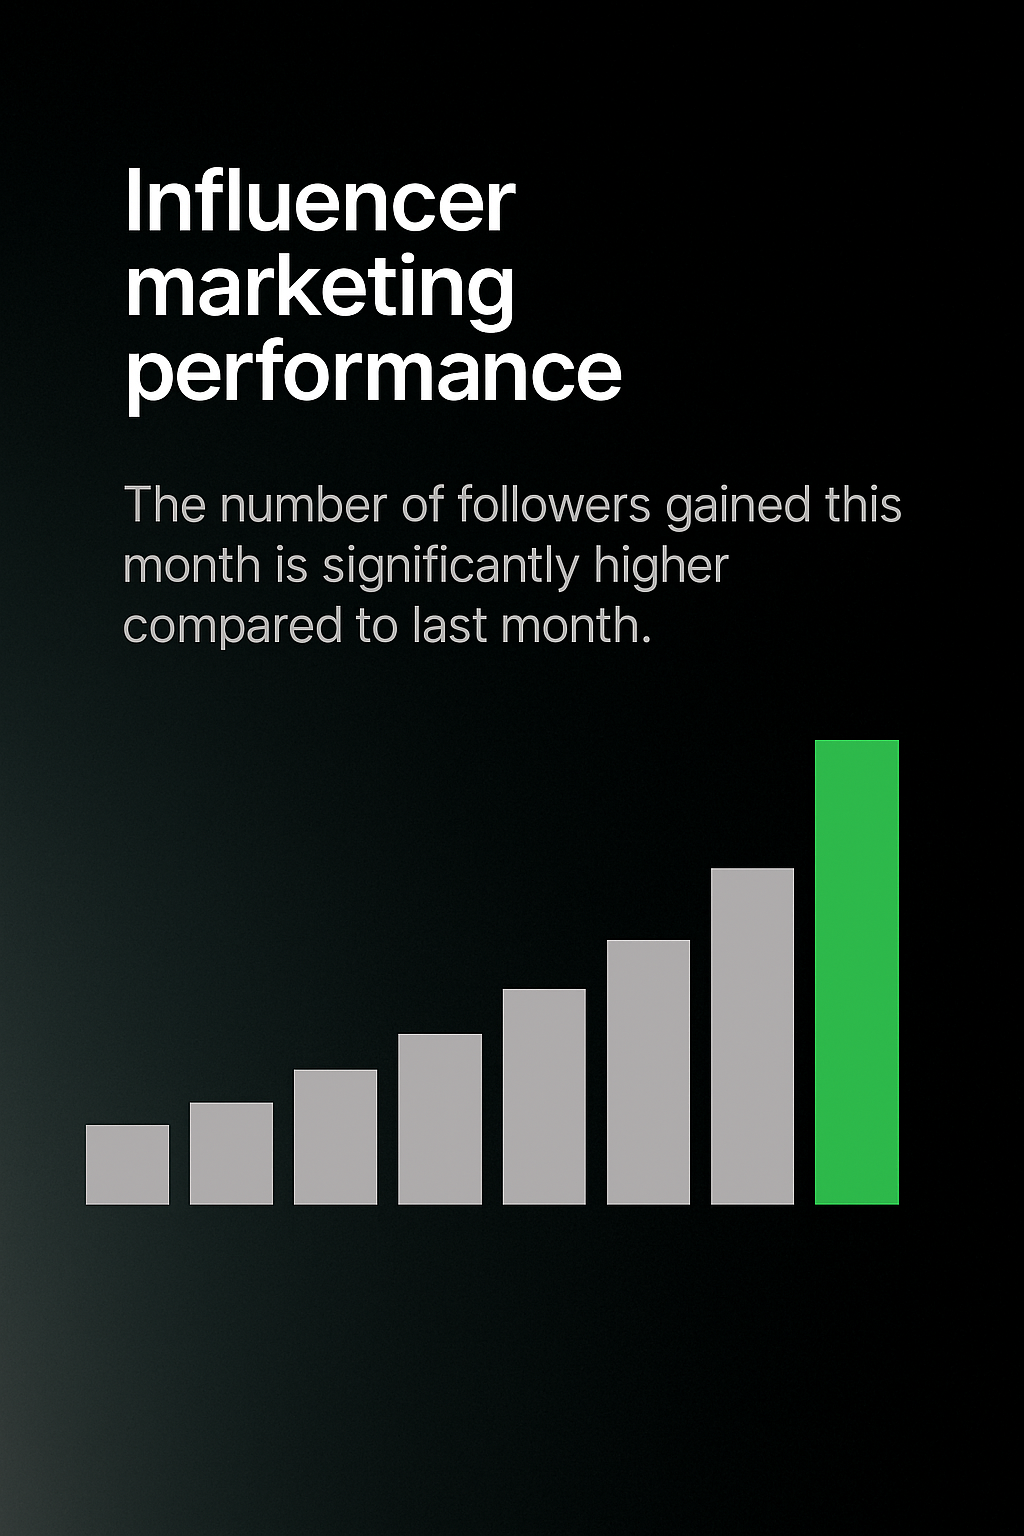
Data Visualization for Influencer Marketing Performance
/Free/Collection: /by davooda/Type: PNG/Informative infographic showcasing influencer marketing performance through a simple bar chart, emphasizing growth in followers. Ideal for marketing reports.