System maintenance in progress
System maintenance
- Some features may be temporarily unavailable.
Search
Sign In
Edit in Shortodella
Auto
2:3
Edit in Shortodella
Auto
2:3
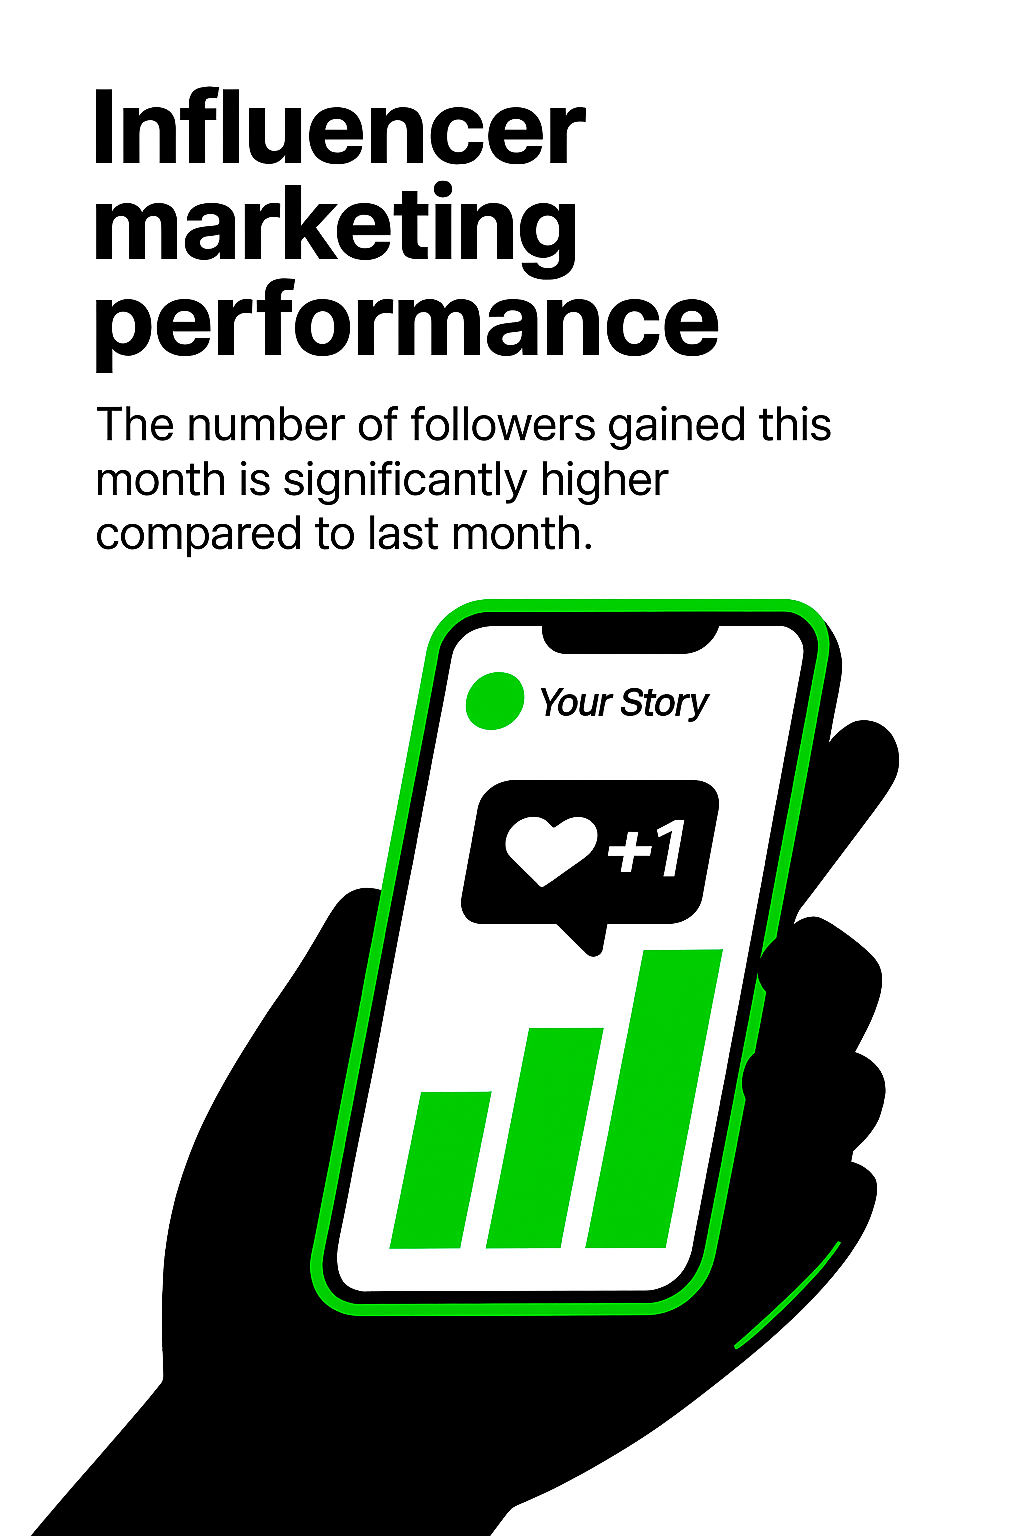
Influencer Marketing Performance Graphic with Data Visualization
/
Free
/
Collection:
Abyss
/
by davooda
/
Type: PNG
/
Stylish infographic highlighting influencer marketing performance metrics, featuring a smartphone displaying follower growth data, suitable for marketing reports.
Influencer Marketing Performance Analysis Graphic
Influencer Marketing Performance Analysis Graphic
Infographic on Influencer Marketing Performance Metrics
Informative Graphic on Influencer Marketing Strategies
Influencer Marketing Performance Dashboard Illustration
Influencer Marketing Performance Analysis Graphic
Data Visualization for Influencer Marketing Performance
Data Visualization of User and Revenue Growth Metrics
Digital Marketing Performance Graphic with Data Visualization
Infographic on Influencer Marketing Performance Metrics
Illustrative Graphic for Channel Analytics Report
Influencer Marketing Performance Report Graphic
Influencer Marketing Performance Graphic with Engaging Visuals
Illustrative Graphic for Instagram Story Engagement
Infographic on Influencer Marketing Strategies
Data Visualization for Influencer Marketing Performance
Performance Growth Chart with Positive Feedback Symbol
Data Visualization of Influencer Marketing Performance Over Time
Performance Metrics Infographic with Key Indicators
Influencer Marketing Performance Metrics Graphic
Illustrative Graphic on Influencer Marketing Analytics
Influencer Marketing Performance Data Visualization
Illustrative Graphic for Influencer Marketing Concept
Colorful Infographic on Influencer Marketing Strategies
Illustration of a Person Engaging with Analytics Growth on Mobile
Illustrative Graphic on Audience Engagement in Social Media
Social Media Post KPI Comparison Graphic
Influencer Marketing Concept with Blue Hearts
Graphical Representation of Performance Metrics with Bold Typography
Performance Gauge Graphic with Bold Typography
Performance Meter Graphic with Thumbs Up Icon
Performance Growth Chart with Positive Feedback
Vibrant Social Media Marketing Promotional Graphic
KPI Performance Metrics Graphic for Business Analysis
Stylized Graphic Representing Key Performance Indicators
Performance Gauge Icon with Minimalistic Design
Informative Graphic on Influencer Marketing Concepts
Performance Meter Graphic Illustrating Measurement Concept
Infographic on Influencer Marketing Campaigns
Performance Meter Graphic with Bold Typography
Illustration of User Interaction with Mobile App
Performance Gauge Graphic with Indicator
Performance Gauge Icon with Bold Typography
Influence Marketing Promotional Graphic with Heart Motif
User Demographics Bar Chart with Age Distribution
Performance Meter Graphic Indicating Efficiency Level
Smartphone with Social Media Reactions in a Modern Office
Performance Gauge Graphic with Engaging Visual Elements
Influencer Marketing Strategy Graphic with Checklist
Illustrative Graphic for Influencer Marketing Concept
Illustrative Graphic on Influencer Marketing Concept
Influencer Marketing Concept with Heart Symbols
Informative Graphic on Key Performance Indicators (KPIs)
Performance Meter Graphic Indicating High Performance Level
Colorful Social Media Engagement Illustration with Abstract Figures
Promotional Tag for Sponsored Content with Heart Design
Business Performance Infographic with Graph and Happy Icon
Promotional Graphic on Influencer Collaborations
Performance Indicator Graphic with Gauge and Thumbs Up
Promotional Social Media Post for Influencer Marketing
Infographic on the Impact of Social Media Influencers
YouTube Analytics Visualization for Performance Tracking
Infographic Displaying KPI Progress Metrics with Visual Elements
Performance Indicator Graphic with Hand and Gauge
KPI Comparison Graphic with Smartphone Illustrations
Performance Gauge Icon with Red and White Color Scheme
3D Illustration for Influencer Marketing Concept
Performance Gauge Graphic Indicating Metrics
Informative Graphic on Key Performance Indicators
Digital Influencer Agreement Signing Graphic
Content Monetization Graphic with Earnings Overview
Performance Meter Graphic with Hand Interaction
Illustrative Graphic of Audience Engagement on Mobile Device
Informative Graphic on Marketing Strategies and KPIs
Infographic on Audience Analysis for Influencer Engagement
3D Heart Icons Representing Influencer Marketing Concept
Performance Gauge Graphic with Hand Interaction
Engaging Social Media Promotion with Audience Growth Theme
Positive Growth Indicator with Thumbs Up Symbol
Informative Graphic on Marketing Strategies and KPIs
Social Media Follower Milestone Graphic
3D Illustration for Engaging Web Page Design Featuring Influencer
Visual Representation of Key Performance Indicators for Marketing
Digital Contract Signing Illustration for Influencers
Informative Graphic on Influencer Marketing Strategies
Dynamic Marketing Message with Megaphone on Orange Background
Infographic Representing Gender Follower Distribution
Performance Gauge Illustration with Clear Indicators
3D Web Page Design Featuring Activity Tracking Feature
Minimalist Analytics Illustration with Graphs and Data
Social Media Engagement Promotion Graphic
Illustration of Filming an Instagram Story with Mobile Device
Illustrative Graphic on Influencer Verification Benefits
Illustrative Graphic Representing Social Media Followers Count
Influence Marketing Concept with Heart Icons and Text
Visual Concept for Influencer Marketing Analysis
Infographic on Key Business Strategies and Metrics
Influencer Campaign Promotion Graphic with 3D Elements
Digital KPI Comparison Graphic for Social Media Posts
Performance Gauge Graphic with Bold Typography
Content Monetization Analytics Graphic
Marketing Performance Dashboard Graphic
Colorful Illustration Explaining Influencer Marketing Concept
Email Marketing Performance Infographic Highlighting Key Metrics
Illustration of Social Media Engagement with Algorithm Focus
Mobile Phone Displaying Social Media Algorithm Insights
Traffic Analysis Infographic with Growth Metrics
Visual Representation of Social Media Engagement Metrics
KPI Infographic for Data Visualization and Analysis
Influencer Marketing Concept with Heart Graphics
Financial Growth Infographic Highlighting ROI
Illustrative Graphic of Influencer Marketing Concept
Informative Graphic on Tracking Website Performance Metrics
Fitness Tracking App Interface on Smartphone
Digital Engagement Metrics Visualization with Energy Bars
Informative Graphic on Social Media Engagement
Modern Information Design for Data Usage Monitoring
Social Media Growth Concept with Mobile Interface
Financial Investment Analysis Graphic with Trend Chart
Engaging Mobile Marketing Graphic with Interactive Elements
Informative Infographic on Campaign Performance Metrics
Informative Graphic on Post KPIs and Performance Measurement
Illustrative Graphic of Influencer Contract Agreement on Mobile Device
Illustrative Graphic on Influencer Marketing Concepts
Modern Information Design: Data Usage Visualization
Crypto Trading App Promotion with Graph and Price Indicators
Mobile Mockup Template for Story Engagement
Audience Interests Infographic with Data Visualization
Infographic Elements Representing Marketing Metrics and Strategies
Infographic on Return on Influence Concept
Infographic Highlighting Key Performance Indicators (KPIs)
Case Study Results Highlighting Key Metrics
Business Strategy Infographic Highlighting Key Metrics and Actions
Illustrative Graphic on Online Engagement Metrics
Data Analytics Illustration with Graphs and Percentages
Informative KPI Graphic for Business Metrics
Testimonial Promotion Graphic Featuring Smartphone Interface
Modern Data Visualization Graphic with Bar Chart and Engaging Design
Informative Infographic on Mobile Usage Statistics
Market Analysis Graphic with Data Visualization
Goal Tracking Illustration with Growth Metrics
Financial Insights Dashboard for Analysis
Visual Representation of Social Media Engagement Metrics
KPI Infographic with Performance Metrics and Graphs
Concert Attendance Data Infographic with Visual Statistics
Live Concert Attendance Infographic with Statistics
Engaging Mobile Notification Graphic for Social Media Marketing
Conference Attendance Infographic with Key Statistics
Illustrative Guide to Measuring Noise Levels with Smartphone
Detailed 3D Illustration of Data Visualization