System maintenance in progress
System maintenance
- Some features may be temporarily unavailable.
Search
Sign In
Edit in Shortodella
Auto
2:3
Edit in Shortodella
Auto
2:3
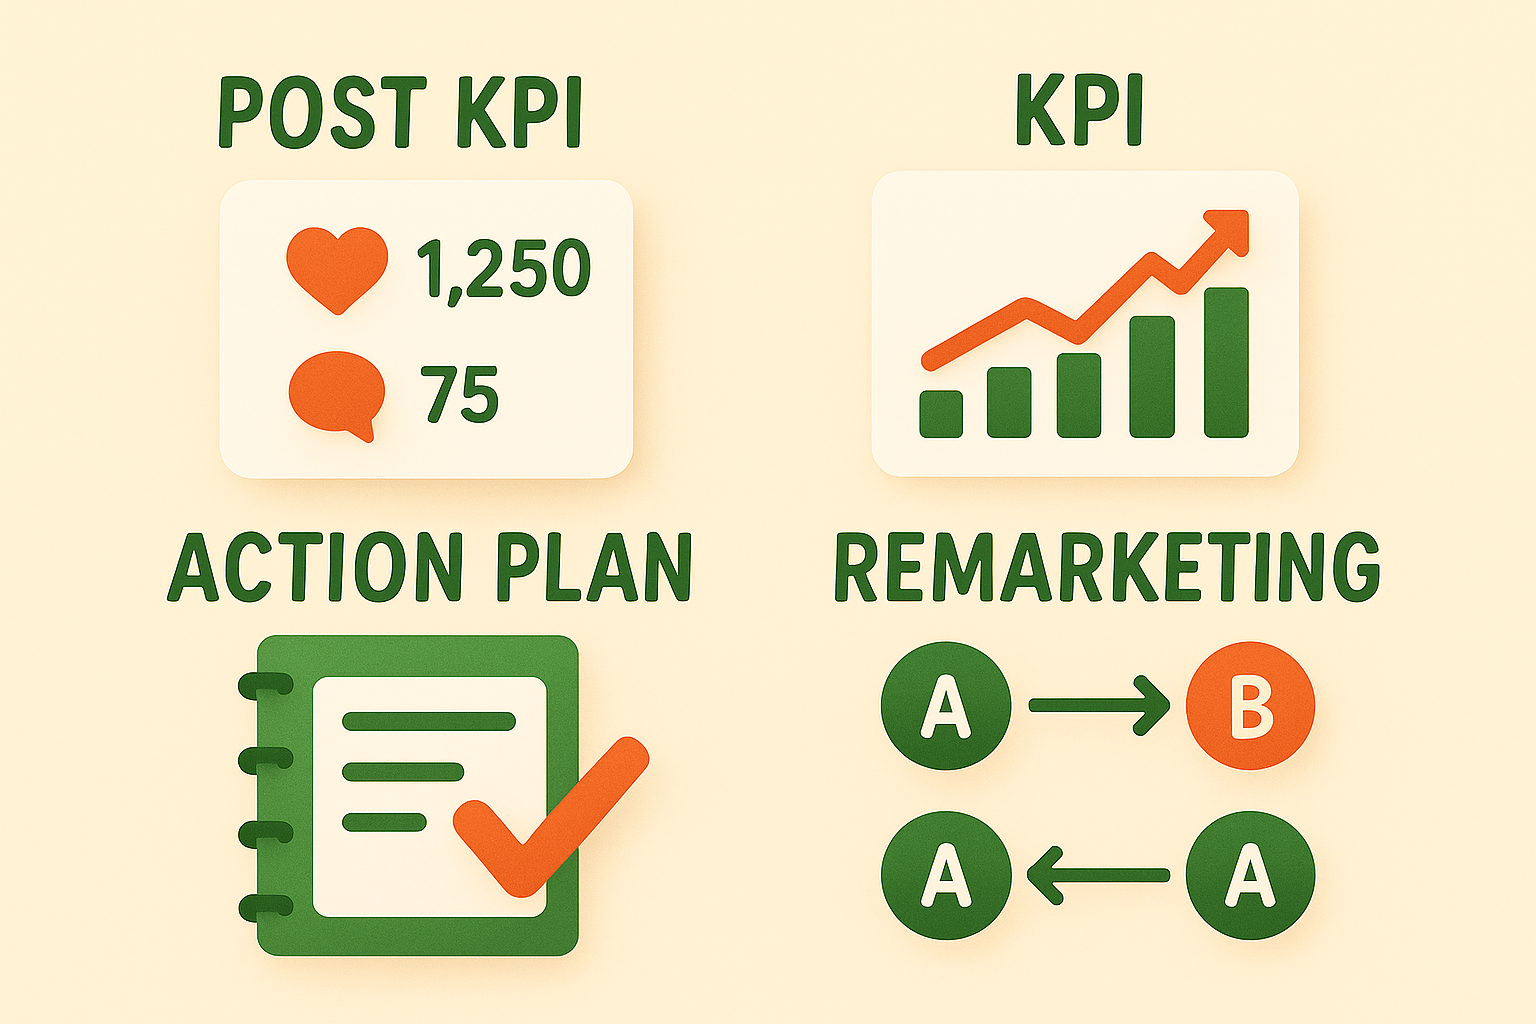
Marketing Performance Dashboard Graphic
/
Free
/
Collection:
Let's Present
/
by davooda
/
Type: PNG
/
Informative infographic highlighting key performance indicators (KPIs) and action plans in marketing, designed with a clean and modern aesthetic suitable for presentations.
Infographic on Marketing Strategies with Visual Icons
KPI Comparison Graphic with Smartphone Illustrations
KPI Infographic for Data Visualization and Analysis
Informative Graphic on Marketing Strategies and KPIs
Colorful Infographic Representing KPI and Action Plan Concepts
Infographic on Key Business Strategies and Metrics
Infographic Elements Representing Marketing Metrics and Strategies
Informative Graphic on Marketing Strategies and KPIs
Informative Graphic on Key Performance Indicators (KPIs)
Business Strategy Infographic Highlighting Key Metrics and Actions
Colorful Infographic on Marketing Concepts and Strategies
Informative Graphic on Key Performance Indicators (KPIs)
Informative Graphic on Marketing Strategies and KPIs
Social Media Post KPI Comparison Graphic
Informative KPI Graphic for Business Metrics
Informative Graphic on Key Performance Indicators and Action Plans
Infographic Highlighting Key Performance Indicators (KPIs)
Informative Graphic on Business Strategies and Metrics
Colorful Infographic Illustrating Business Performance Metrics
Illustrative Diagram for Cybersecurity Planning and Metrics
KPI Performance Metrics Graphic for Business Analysis
Informative Graphic on KPI Posts and Lead Generation
Digital KPI Comparison Graphic for Social Media Posts
Informational Graphic on Web Metrics and Strategies
Illustrative Infographic on Key Performance Indicators (KPI)
Informative Infographic on Business Strategies and Metrics
Informative Graphic on Post KPIs and Performance Measurement
Visual Illustration of AI Integration in Marketing Strategies
Informative Graphic on Key Performance Indicators
Informative Graphic on KPI Metrics for Performance Evaluation
Infographic Illustrating Action Steps for Project Management
Stylized Graphic Representing Key Performance Indicators
E-commerce Marketing Infographic with Key Concepts
Comparison Infographic of Post Performance Metrics
Informative Graphic Representing Business KPIs and Marketing Strategies
KPI Post Comparison Graphic with Illustrated Tablets
Infographic on SEO Strategies with Action Plan Elements
Illustrative Action Plan Infographic for Goal Setting
Visual Representation of Social Media Engagement Metrics
Infographic Displaying KPI Progress Metrics with Visual Elements
Colorful Educational Graphics for Digital Marketing Concepts
KPI Infographic with Performance Metrics and Graphs
Stylish Blue Background with Geometric Shapes and Icons
Illustrative Action Plan Infographic with Clear Steps
Engaging Digital Marketing Infographic on Call to Action Strategies
Informative Graphic on Key Performance Indicators (KPIs)
Minimalist Analytics Illustration with Graphs and Data
Visual Representation of Key Performance Indicators for Marketing
Dynamic Marketing Message with Megaphone on Orange Background
Illustrative Graphic on Return on Investment Concepts
Colorful Informational Graphic on Marketing Concepts
Dynamic Goal Tracker Board with 3D Elements and Gradient Background
Positive Growth Indicator with Thumbs Up Symbol
Stylized 3D Bar Graph Showing Growth Trend
Content Planning Calendar Graphic with Minimalist Design
Creative Business Planning Concept with Sticky Notes
Modern Data Visualization Graphics on Transparent Panels
Informative Graphic on Digital Marketing Strategies
Business Professional Analyzing Graphs and Charts
3D Laptop with Rising Graph and Charts on Purple Background
Dynamic Business Meeting with Team Collaboration and Strategy Planning
Illustrative Graphic on Growth Metrics and Financial Trends
Close-up of a Dart Hitting a Colorful Target Board
Infographic on Influencer Marketing Performance Metrics
Illustrative Infographic of a Workflow Process
Professional Accountant Analyzing Data with Laptop and Calculator
Modern KPI Dashboard Displaying Performance Metrics
Illustrative Graphic Representing Artificial Intelligence Concepts
Handshake Icon Representing Agreement and Friendship
Informative Graphic on Cybersecurity Metrics and Strategies
Bullseye Target with Arrow Hitting Center at Sunset
Social Media Content Planning Calendar Graphic
Vibrant Social Media Marketing Promotional Graphic
Data Visualization of User and Revenue Growth Metrics
Dynamic Financial Chart with Rising Trends and Urban Background
Infographic on Influencer Marketing Performance Metrics
Stylized Graph Showing Financial Growth with Dollar Coin
Smartphone with Social Media Reactions in a Modern Office
Colorful Infographic on Digital Marketing Strategies
Digital Marketing Performance Graphic with Data Visualization
Creative Graphic on Hashtag Content Strategy
Performance Growth Chart with Positive Feedback Symbol
Golden Coin with Indian Rupee Symbol on Growth Chart Background
Stylized Blue Megaphone on Background
Dynamic Business Meeting with Team Collaboration on Strategy
Content Planning Graphic with Strategic Workflow Elements
Healthcare Growth Chart with Medical Elements
Influencer Campaign Promotion Graphic with 3D Elements
Stylized Financial Growth Chart with Dollar Coin
Stylized Digital Workspace with Orange Accents and Checklists
Influencer Marketing Performance Dashboard Illustration
Modern Landing Page Mockup for Instagram Notification
Growth Chart with Rising Arrow Illustration
Digital Security Concepts with Lock and Key Elements
Cheerful Character Celebrating Achievement with Trophy and Graph
Dynamic Landing Page Design with 3D Elements
Close-up of a Dartboard with an Arrow Hitting the Center
Stylized 3D Icon of a Deadlift in Soft Glow
Illuminated Chess Pieces in Play with a Hand Moving a Knight
Minimalist Target with Arrow Illustration
Email Marketing Performance Infographic Highlighting Key Metrics
Performance Metrics Infographic with Key Indicators
Informative Infographic on Campaign Performance Metrics
Interactive Data Dashboard Promotional Graphic
Informative Graphic on Tracking Website Performance Metrics
Influencer Marketing Performance Report Graphic
Influencer Marketing Performance Data Visualization
Influencer Marketing Performance Graphic with Data Visualization
Financial Insights Dashboard for Analysis
Market Analysis Graphic with Data Visualization
Traffic Analysis Infographic with Growth Metrics
Influencer Marketing Performance Analysis Graphic
Modern dashboard interface design
Marketing and Sales Strategy Graphic with Key Points
Financial Dashboard Visualization with Data Insights
Influencer Marketing Performance Metrics Graphic
Case Study Results Highlighting Key Metrics
Business Analytics Concept with KPI Dashboard Visuals
Market Analysis Infographic with Data Highlights
Influencer Marketing Performance Analysis Graphic
Goal Tracking Illustration with Growth Metrics
Professional Data Presentation and Evaluation Graphic
Data Visualization of Influencer Marketing Performance Over Time
Business Performance Analysis Graphic with Trend Chart
Holiday Sales Analytics Infographic with Visual Elements
Infographic on Software Development Metrics with Illustrative Style
Informative Graphic on AI Integration and Key Performance Indicators
Data Visualization for Influencer Marketing Performance
Data Analytics Illustration with Graphs and Percentages
Financial Investment Analysis Graphic with Trend Chart
Market Growth Trends Visualization with Strategic Insights
Business Audit Infographic with Key Performance Indicators
Landing Page Design for Marketing Strategies and Features
Dynamic Real-Time Analytics Dashboard Graphic
Interactive Financial Data Dashboard Promotion
Data Analytics Promotional Graphic with Modern Design
Influencer Marketing Performance Analysis Graphic
Colorful Infographic Design Illustrating Data Visualization Concepts
Influencer Marketing Performance Graphic with Engaging Visuals
Dynamic Data Visualization for Business Process Automation
Content Monetization Analytics Graphic
Visual Representation of Charts and Data Overview
Modern Data-Driven Marketing Design for Startups
Graphical Representation of Performance Metrics with Bold Typography
Infographic Highlighting Case Study Results with Graphical Elements
Informative Product Features Graphic with Icons
Business Audit Infographic for Financial Strategy Insights
Real-Time Analytics Dashboard with Data Visualizations
Market Research Infographic Summary with Key Insights
Digital Data Exploration and Analytics Graphic