Search
Sign In
2:3
2:3
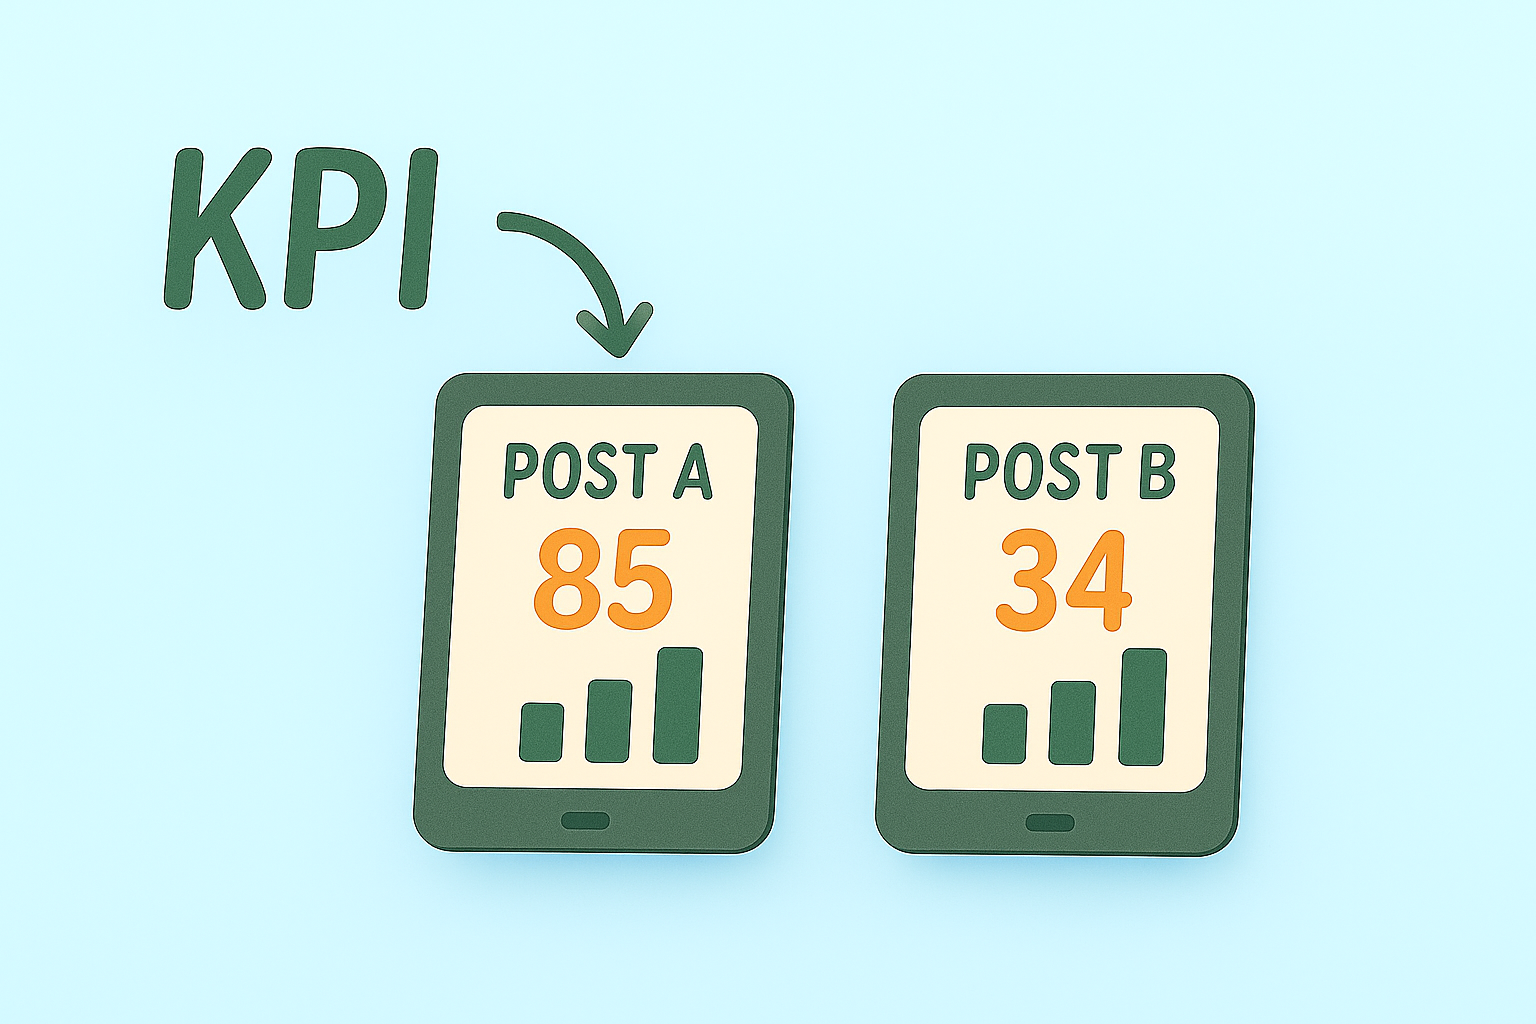
KPI Comparison Graphic with Smartphone Illustrations
/
Collection:
Let's Present
/
by davooda
/
Type: PNG
/
Illustrative graphic depicting a KPI comparison between two posts using smartphone visuals. Ideal for presentations or reports in marketing and analytics.
Social Media Post KPI Comparison Graphic
Digital KPI Comparison Graphic for Social Media Posts
KPI Post Comparison Graphic with Illustrated Tablets
Stylized Graphic Representing Key Performance Indicators
Marketing Performance Dashboard Graphic
Infographic Highlighting Key Performance Indicators (KPIs)
KPI Performance Metrics Graphic for Business Analysis
Visual Representation of Social Media Engagement Metrics
Informative Graphic on Key Performance Indicators (KPIs)
Comparison Infographic of Post Performance Metrics
Informative Graphic on KPI Metrics for Performance Evaluation
Informative KPI Graphic for Business Metrics
Infographic Displaying KPI Progress Metrics with Visual Elements
Informative Graphic on Key Performance Indicators (KPIs)
Informative Graphic on Post KPIs and Performance Measurement
KPI Infographic with Performance Metrics and Graphs
Informative Graphic on KPI Posts and Lead Generation
KPI Infographic for Data Visualization and Analysis
Colorful Infographic Illustrating Business Performance Metrics
Business Strategy Infographic Highlighting Key Metrics and Actions
Illustrative Infographic on Key Performance Indicators (KPI)
Informative Graphic on Key Performance Indicators
Informative Graphic on Marketing Strategies and KPIs
3D Hand Holding Bar Graph with Upward Trend Arrow
Informative Graphic on Marketing Strategies and KPIs
3D Chart Icon Representing Growth and Progress
3D Bar Chart Icon Representing Growth Metrics
Infographic on Key Business Strategies and Metrics
3D Bar Chart Illustration Representing Growth
3D Illustration of a Data Analysis Monitor with Graph
3D Smartphone Icon with Data Bars and Plus Sign
Colorful Infographic Representing KPI and Action Plan Concepts
Stylized Bar Chart Illustration for Data Visualization
Colorful Gauge Icon Representing Measurement Levels
3D Bar Chart with Heart Icon for Data Visualization
3D Bar Chart Illustration Representing Growth
Informative Graphic on Marketing Strategies and KPIs
Stylized Bar Graph with Upward Trend
3D A/B Testing Icon with Colorful Elements
3D Graph Icon Representing Growth and Progress
3D Graph Icon Representing Data Trends
Minimalist Analytics Illustration with Graphs and Data
Visual Representation of Key Performance Indicators for Marketing
Stylized Bar Chart Icon for Data Visualization
3D Graph Icon with Magnifying Glass for Analysis
Infographic on Marketing Strategies with Visual Icons
3D Icon of a Growth Chart on Clipboard
Stylized Funnel Graphic with Rising Bars
3D Financial Chart Icon with Graph and Magnifying Glass
3D A/B Testing Icon with Volumetric Design
Stylish 3D Bar Graph Icon with Percentage Symbol
Stylized 3D Financial Chart Icon for Analysis
3D Coaching Icon Representing Performance Improvement
3D Bar Chart Icon with Magnifying Glass in Isometric View
3D Compound Interest Growth Icon with Volumetric Feel
3D Bar Chart Icon with Magnifying Glass in Isometric View
3D Coin Growth Icon Representing Earnings Increase
3D Quant Icon with Calculator and Bar Graph
Informative Graphic on Business Strategies and Metrics
Stylized 3D Copy Trading Icon in Isometric View
Colorful Infographic on Marketing Concepts and Strategies
Illustration of a Person Engaging with Analytics Growth on Mobile
3D Bar Graph Illustration Representing Growth
Stylish 3D Limit-Order Icon with Graph and Checkmarks
Colorful 3D Bar Graph Icon with Percentage Symbol
3D A/B Testing Icon with Volumetric Design
3D Social Media Marketing Icon with Graph and Megaphone
3D Isometric Icon of a Growth Chart with Colorful Bars
3D Performance Dashboard Gauge Icon in Isometric View
Illustration of User Interaction with Mobile App
Colorful 3D Dollar Bar Graph Icon in Isometric View
3D Document Icon with Graphs and Pencil Design
Informative Graphic Representing Business KPIs and Marketing Strategies
3D Icon Representing Growth in Data Analytics
Stylish 3D Dashboard Gauge Icon for Performance Metrics
Stylish 3D Data Analytics Icon in Isometric View
3D Icon Representing OKR Framework with Target and Graph
Colorful Gauge Icon Representing Measurement
3D Icon Representing Financial Growth and Profit Increase
3D Stacked Coins Icon with Arrow Showing Growth
Stylized Bar Graph with Upward Arrow Representing Growth
3D Social Media Marketing Icon with Isometric Design
3D Growth Icon Depicting Progress with Arrows
3D Finance Icon with Growing Graph and Coin
3D Phone Icon with Arrow in Isometric View
Stylish 3D Meter Icon with Volumetric Design
Stylish 3D Isometric Icon for Presentation Decks
3D Magnifying Glass Over Graph Icon for Data Analysis
Infographic Elements Representing Marketing Metrics and Strategies
3D Graph Icon Representing Growth Metrics
Stylized 3D Financial Icon with Report and Calculator
Performance Growth Chart with Positive Feedback Symbol
3D Money Growth Icon with Chart and Bag
Stylized 3D Promoter Score Icon with Smiley Faces
Stylish 3D Gauge Icon with Colorful Levels
Performance Gauge Graphic with Bold Typography
3D Pie Chart Icon Representing Data Segmentation
3D Financial Chart Icon with Analysis Elements
3D Blueprint Design with Pencil and Charts
3D Bar Graph with Star Symbol Representing Growth
Infographic on Influencer Marketing Performance Metrics
Influencer Marketing Performance Analysis Graphic
Infographic on Influencer Marketing Performance Metrics
SEO Marketing Promotion with Mobile Device Visuals
Influencer Marketing Performance Graphic with Data Visualization
Influencer Marketing Performance Analysis Graphic
Mobile Usage Infographic with Statistics and Illustration
Illustrative Guide to Measuring Noise Levels with Smartphone
Illustration of Product Comparison with Pros and Cons
Fitness Tracking App Interface on Smartphone
Illustration of Price Comparison for Shopping
Performance Metrics Infographic with Key Indicators
Infographic on Smartphone Usage with Modern Design Elements
Informative Graphic on Tracking Website Performance Metrics
Digital Marketing Performance Graphic with Data Visualization
Influencer Marketing Performance Dashboard Illustration
Illustration of Sleep Tracking Mobile App Interface
Mobile App Interface for Uploading Test Results
Mobile App Price Comparison Illustration
Stylish Smartphone Illustration with Features Overview
Financial Monitoring Illustration with Mobile Phone and Stock Chart
Illustration of Solar Monitoring Concept with Mobile Device
Professional Data Presentation and Evaluation Graphic
Customer Feedback Illustration with Smartphone and Reviews
Informative Graphic on Key Performance Indicators and Action Plans
Engaging Mobile Marketing Graphic with Interactive Elements
Mobile App Showcase for Health Metrics Tracking
Mobile Mockup Template for Story Engagement
User Review Graphic Featuring Smartphone and Ratings
Illustration of a High Credit Score on a Smartphone
Illustration of Social Media Engagement with Algorithm Focus
Illustration of Podcasting Concept on Smartphone
Goal Tracking Illustration with Growth Metrics
Vibrant Social Media Marketing Promotional Graphic
Illustration of Positive Feedback on a Presentation with Mobile Device
User Engagement Concept Illustration with Social Media Icons
Stylized Mobile Marketing Article Mockup
Testimonial Promotion Graphic Featuring Smartphone Interface
Mobile App Interface for Step Tracking and Goal Achievement
Illustration of Mobile App Functionality Testing
Illustration of a Content Planning Concept with Smartphone
Digital Boarding Pass and Passport Check-in Illustration
Mobile Phone Displaying Social Media Algorithm Insights
Informative Infographic on Mobile Usage Statistics
Illustration of Food Diary and Calorie Tracker
Illustration for Podcast Recording Instructions
Graphical Representation of Performance Metrics with Bold Typography
Creative Illustration on Content Monetization Strategies
Heart Rate Monitoring Graphic for Fitness Apps