System maintenance in progress
System maintenance
- Some features may be temporarily unavailable.
Search
Sign In
Edit in Shortodella
Auto
2:3
Edit in Shortodella
Auto
2:3
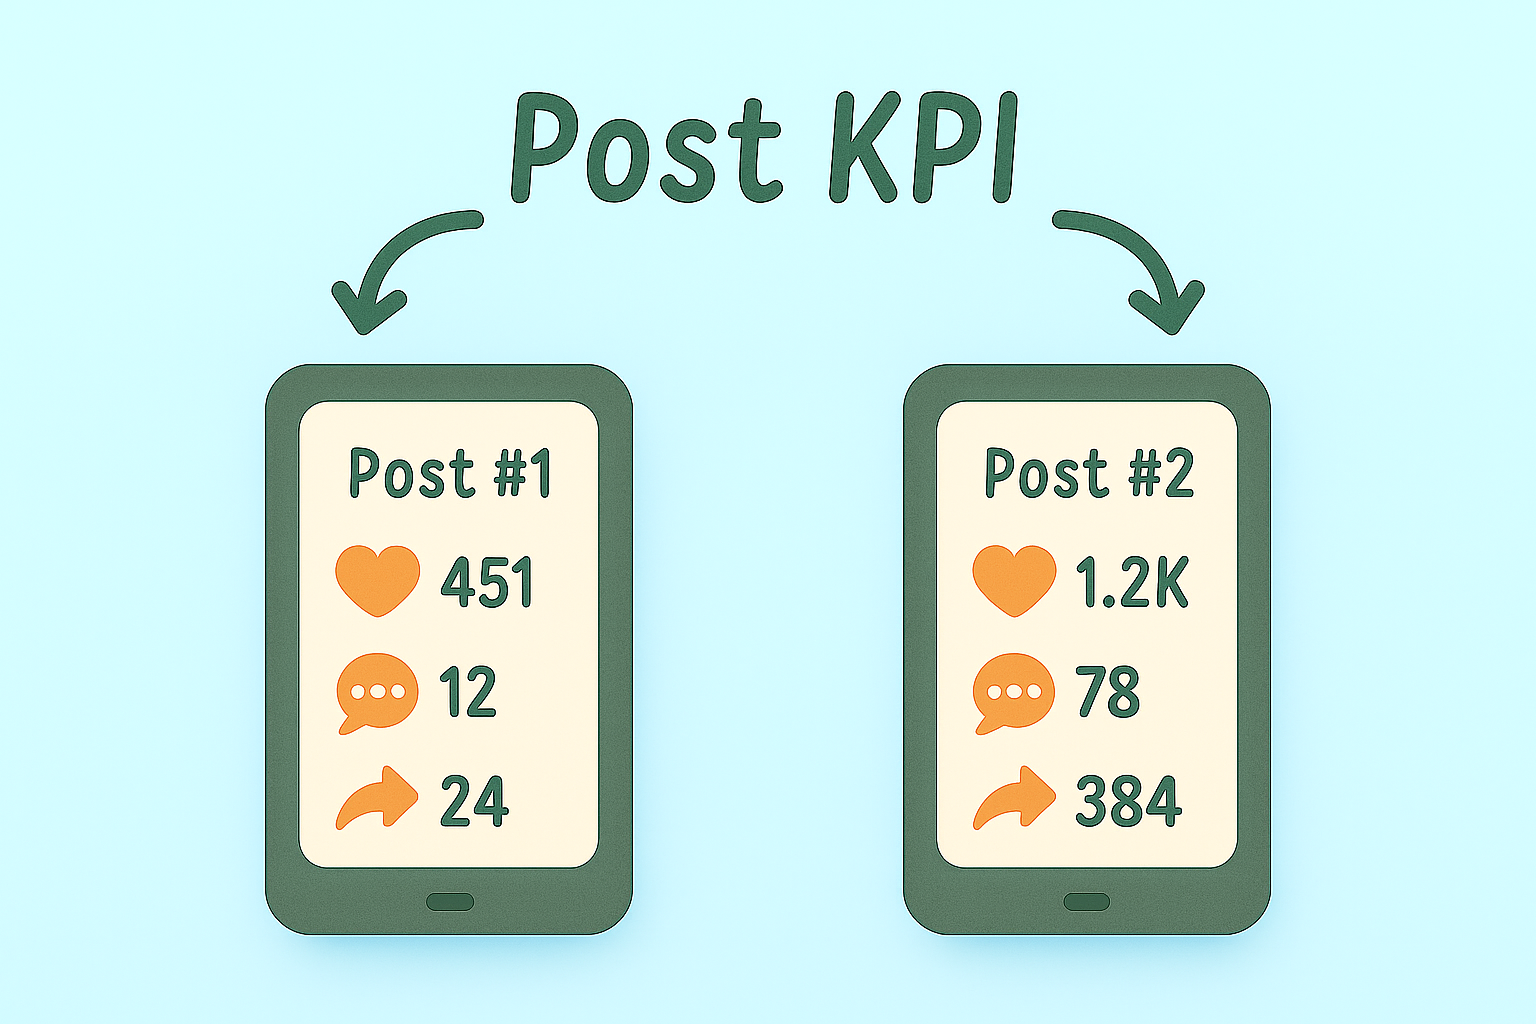
Social Media Post KPI Comparison Graphic
/
Free
/
Collection:
Let's Present
/
by davooda
/
Type: PNG
/
Illustrative infographic comparing key performance indicators (KPIs) of two social media posts, designed in a modern and simplistic style for digital marketing analysis.
KPI Comparison Graphic with Smartphone Illustrations
Stylized Graphic Representing Key Performance Indicators
Visual Representation of Social Media Engagement Metrics
Digital KPI Comparison Graphic for Social Media Posts
KPI Performance Metrics Graphic for Business Analysis
Infographic Highlighting Key Performance Indicators (KPIs)
KPI Post Comparison Graphic with Illustrated Tablets
Informative Graphic on Post KPIs and Performance Measurement
Marketing Performance Dashboard Graphic
Informative Graphic on KPI Metrics for Performance Evaluation
Informative Graphic on Key Performance Indicators (KPIs)
Comparison Infographic of Post Performance Metrics
Informative Graphic on Key Performance Indicators (KPIs)
Informative Graphic on KPI Posts and Lead Generation
KPI Infographic with Performance Metrics and Graphs
Smartphone with Social Media Reactions in a Modern Office
KPI Infographic for Data Visualization and Analysis
Informative KPI Graphic for Business Metrics
Infographic Displaying KPI Progress Metrics with Visual Elements
Infographic on Influencer Marketing Performance Metrics
Illustration of User Interaction with Mobile App
Informative Graphic on Key Performance Indicators
Colorful Infographic Illustrating Business Performance Metrics
Illustrative Infographic on Key Performance Indicators (KPI)
Informative Graphic on Marketing Strategies and KPIs
Stylish Blue Background with Geometric Shapes and Icons
Colorful Infographic Representing KPI and Action Plan Concepts
Informative Graphic on Marketing Strategies and KPIs
Informative Graphic on Marketing Strategies and KPIs
Business Strategy Infographic Highlighting Key Metrics and Actions
Handshake Icon Representing Agreement and Friendship
Infographic on Influencer Marketing Performance Metrics
Visual Representation of Key Performance Indicators for Marketing
Positive Growth Indicator with Thumbs Up Symbol
Digital Marketing Performance Graphic with Data Visualization
Infographic on Key Business Strategies and Metrics
Creative Graphic on Hashtag Content Strategy
Influencer Marketing Performance Dashboard Illustration
Minimalist Analytics Illustration with Graphs and Data
Stylized 3D Bar Graph Showing Growth Trend
Influencer Marketing Performance Analysis Graphic
Data Visualization for Influencer Marketing Performance
Colorful Infographic on Marketing Concepts and Strategies
Influencer Marketing Performance Graphic with Data Visualization
User Engagement Concept Illustration with Social Media Icons
Illustration of a Person Engaging with Analytics Growth on Mobile
Infographic on Marketing Strategies with Visual Icons
Illustrative Graphic on Influencer Marketing Analytics
Informative Graphic Representing Business KPIs and Marketing Strategies
Infographic on SEO Strategies with Action Plan Elements
Modern KPI Dashboard Displaying Performance Metrics
Data Visualization of Influencer Marketing Performance Over Time
Influencer Marketing Performance Analysis Graphic
Informative Graphic on Business Strategies and Metrics
Data Visualization for Influencer Marketing Performance
Colorful Social Media Engagement Illustration with Abstract Figures
Informative Graphic on Key Performance Indicators and Action Plans
Dynamic Goal Tracker Board with 3D Elements and Gradient Background
Healthcare Growth Chart with Medical Elements
Illustrative Graphic on Audience Engagement in Social Media
Data Visualization of User and Revenue Growth Metrics
Performance Meter Graphic with Thumbs Up Icon
Social Media Engagement Promotion Graphic
Social Media Optimization Concept with Search Elements
Infographic Elements Representing Marketing Metrics and Strategies
Stylized Graph Showing Financial Growth with Dollar Coin
3D Laptop with Rising Graph and Charts on Purple Background
Informational Graphic on Web Metrics and Strategies
Vibrant Social Media Marketing Promotional Graphic
Modern Data Visualization Graphics on Transparent Panels
Performance Growth Chart with Positive Feedback Symbol
Illustrative Diagram for Cybersecurity Planning and Metrics
Informative Graphic on Key Performance Indicators (KPIs)
Influencer Marketing Performance Analysis Graphic
Illustration of Person Engaging with Social Media Comments
Illustrative Graphic on Return on Investment Concepts
Illustrative Graphic on Growth Metrics and Financial Trends
E-commerce Product Display with Customer Reviews
Modern Graph Icon Illustrating Growth and Progress
Influencer Marketing Performance Metrics Graphic
Performance Gauge Graphic Indicating Metrics
Stylized 3D Icon of a Deadlift in Soft Glow
Graphical Representation of Customer Needs Growth
3D Web Page Design Featuring Activity Tracking Feature
Stylized Financial Growth Chart with Dollar Coin
Influencer Marketing Performance Report Graphic
Graphic Representation of Social Media Engagement
Informative Infographic on Business Strategies and Metrics
Performance Meter Graphic with Bold Typography
Social Media Content Planning Calendar Graphic
Graphical Representation of Performance Metrics with Bold Typography
Business Performance Infographic with Graph and Happy Icon
Illustrative Graphic of a Young Woman Engaging with Smartphone
Mobile Product Review Showcase with User Testimonials
Business Professional Analyzing Graphs and Charts
Performance Metrics Infographic with Key Indicators
Mobile E-Commerce Mockup with User Reviews
Performance Gauge Graphic with Bold Typography
Mobile E-Commerce Display with Customer Reviews
E-commerce Product Review Social Media Post
Informative Graphic on Social Media Engagement
Informative Graphic on Tracking Website Performance Metrics
Email Marketing Performance Infographic Highlighting Key Metrics
Digital Engagement Metrics Visualization with Energy Bars
Influencer Marketing Performance Data Visualization
Illustration of Social Media Engagement with Algorithm Focus
Social Media Engagement Tip Graphic with Illustrated Elements
Infographic on the Impact of Social Media Influencers
Visual Representation of Social Media Engagement Metrics
Infographic on Software Development Metrics with Illustrative Style
Informative Graphic on Social Media Algorithms for Engagement
Informative Infographic on Campaign Performance Metrics
Influencer Marketing Performance Graphic with Engaging Visuals
Goal Tracking Illustration with Growth Metrics
Dynamic Social Media Engagement Promotion Graphic
Digital Engagement Infographic with Energy Bars Concept
Engaging Social Media Post on Alerts and Notifications
Professional Board Presentation Tips Visual Guide
Content Monetization Graphic with Earnings Overview
Informative Graphic on Social Media Verification Process
Content Planning Calendar Illustration for Social Media Strategy
Promotional Graphic for Solar Energy Benefits
Social Media Content Planning Graphic
Social Media Content Planning Graphic
Marketing and Sales Strategy Graphic with Key Points
Content Monetization Analytics Graphic
Community Support and Kindness Infographic
Informative Graphic on Christmas Candle Statistics
Informative Graphic on AI Integration and Key Performance Indicators
Content Planning Calendar Graphic for Social Media Strategy
Simple Comparison Chart with Check and Cross Icons
Social Media Content Calendar Illustration for Planning Posts
Professional Data Presentation and Evaluation Graphic
Infographic on Influencer Marketing Strategies
Creative Illustration for Social Media Post Optimization
Business Analytics Concept with KPI Dashboard Visuals
Engaging Social Media Graphic on Positive Feedback
Infographic on Social Media Usage by Age Group
Infographic on Influencer Marketing Campaigns
Content Planning Calendar Illustration for Social Media Management
Promotional Graphic on Compound Interest and Financial Growth
Content Planning Calendar Illustration for Social Media Management
Engagement Strategy Social Media Graphic
Content Planning Infographic with Calendar and Flowchart
Audience Interests Infographic with Data Visualization
Social Media Engagement Graphic with Commentary Interaction
Traffic Analysis Infographic with Growth Metrics
Informative Graphic on Cybersecurity Metrics and Strategies
Infographic on Network Server Performance Metrics
Illustrative Graphic on Audience Collaboration for Content Creators