System maintenance in progress
System maintenance
- Some features may be temporarily unavailable.
Search
Sign In
Edit in Shortodella
Auto
2:3
Edit in Shortodella
Auto
2:3
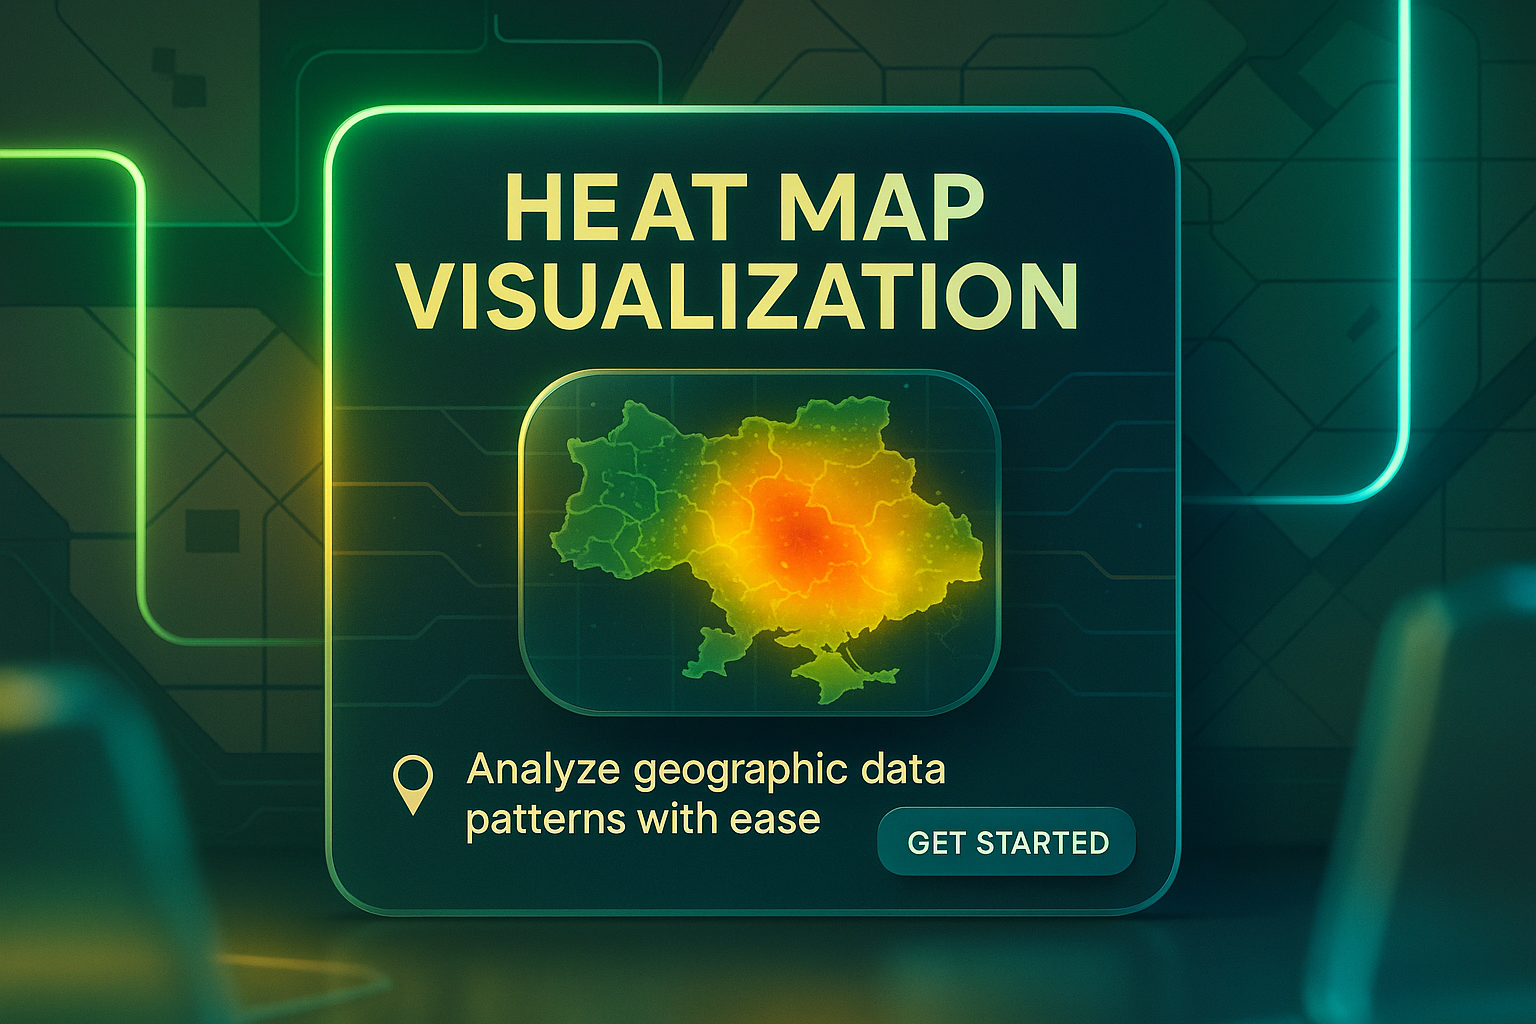
Interactive Heat Map Visualization Interface for Data Analysis
/
Free
/
Collection:
Base
/
by davooda
/
Type: PNG
/
Modern graphic showcasing a heat map visualization interface, designed for analyzing geographic data patterns. Ideal for data analytics platforms.
Interactive Heat Map Visualization Tool for Geographic Data Insights
Detailed 3D Map Scene in Realistic Style
Dynamic Machine Learning Heatmap Visualization
Dynamic 3D Webpage Illustration with Features
Concept of Global Warming and Climate Change Illustrated
Interactive Data Dashboard Promotional Graphic
Detailed 3D Scene Representing Heat Concept with Characters
Interactive Heat Map Visualization for Geo Data Insights
Smartphone Navigation with City Map Illustration
Colorful Machine Learning Heatmap Illustrating Learning Process
Stylish Mind Mapping Landing Page Design
Interactive World Map for Exploration and Discovery
3D Illustration of Heat Control Feature with Dynamic Design
Dynamic Landing Page Design for Data Analysis
Phoenix Candlestick Chart Rising - Data Visualization Concept
Aesthetic Coffee Mug with Steam in Warm Lighting
3D Flame Illustration with Web Design Elements
Realistic 3D Scene Depicting Heat Concepts
Conceptual Illustration of Global Warming and Climate Change
3D Web Page Design Featuring Analyst with Data Visualizations
Concept of Global Warming and Climate Change Visualized
Minimalist Landing Page Design with World Map and CTA
Earth Ignited: The Impact of Global Warming on Climate Change
Futuristic Nebula Background with Machine Learning Concept
Landing Page Design Featuring 3D Illustration for Lepton Tool
Mysterious Smoke Clouds in Green and Blue on Black Background
Detailed 3D Scene Depicting Data Analysis Process
Detailed 3D Illustration of Data Visualization
Informative Digital Banner for Satellite Imagery Services
The Earth on Fire: A Visual Warning of Climate Change
Stylized 3D Weather Icon with Soft Glow
3D Web Page Design Featuring Interactive Learning Elements
3D Illustration of a Satellite Map with Features
Mobile Phone with City Map Highlighting Location
Miniature Real World: Detailed 3D Data Analysis Scene
High-Quality Interactive World Map with Vibrant Colors
Vibrant Desert Map Illustration with Dynamic Elements
3D Abstract Halftone Map of Latvia in Flag Colors
Abstract 3D Finance Illustration for Digital Business
3D Illustration of Weather Forecasting Features
3D Market Analysis Visualization with Graphs and Arrows
3D Flame Design with Text Integration for Web Page
Cyberpunk Hacker Concept Art with Futuristic Elements
Detailed 3D Map with Interactive Features
Warm Hot Coffee Time with Steaming Cup
Detailed Pirate Map Illustration for Treasure Hunt Theme
Realistic 3D Map Scene with Location Pin and Text Elements
Dynamic Bento Style Landing Page Design with Progress Bar
3D Emergency Illustration with Integrated Design Elements
Stunning 3D Illustration of a Black Hole with Informative Overlay
Stylized World Map with Call to Action Button
Realistic 3D Map Scene with Interactive Elements
Dynamic Star Map with Engaging Visual Elements
Dynamic Goal Tracker Board with 3D Elements and Gradient Background
Detailed 3D Weather Scene with Realistic Elements
Stylized Bonfire Illustration with Feature Block
3D Fire Flame Vector Design for Web Integration
3D Illustration for Data Analysis Landing Page
3D Tourist Map Illustration for Navigation and Exploration
Interactive 3D Illustration of Route Navigation Features
Infographic on Statistics and Data Analysis in Neon Design
3D Visual Structure with Location Pin and Text Overlay
3D Black Hole Illustration with Informative Overlay
Realistic 3D Snowy Landscape with Cabin and Trees
3D Illustration of Coordinates with Earth and Location Pin
Integrated 3D Design for Navigation Interface
Educational App Promotion for Learning Mathematics
Ocean of Price Charts in a 3D Illustration
Detailed 3D Map Scene with Magnifying Glass
Dynamic Desert Map with 3D Illustration and Vivid Colors
Holographic Shield Protecting Data Center Security Concept
Dynamic Desert Map Illustration with 3D Elements
3D Scene of Hacker Activity with Neon Accents
Modern Smartwatch with Health Tracking Features
Warm Hot Coffee Time - Cozy Beverage Visual
Realistic 3D Weather Scene with Nature Elements
3D Abstract Halftone Map of Latvia with Modern Design
Isometric Illustration of Energy Generation Facilities
Cryptocurrency Raining from the Sky - Hyperrealistic Art
3D Laboratory Design with Analysis Features
Interactive World Map Exploration Graphic
3D Integration of Location Features with Mapping Capabilities
Person Holding Phone with City Map and Navigation Feature
3D Illustration of a Satellite Map with Features Overview
Digital Security Concept with Lock Symbol and Data Flow
Dynamic Star Map Illustration with Vibrant Colors
Modern Information Design: Data Usage Visualization
Detailed 3D Graph Illustration for Data Analysis
User-Friendly Navigation App with Key Features
Engaging Weather Report Landing Page Design
3D Block Illustration Featuring Brightness Adjustment
Dynamic Real-Time Analytics Dashboard Graphic
Stylish Web Design Featuring an Antique Map Scroll
AI Hand Intercepting Malicious Code - Cybersecurity Concept Art
Stylized 3D Fire Icon with Informative Label
Dynamic Magma Eruption with Realistic Details
Detailed Pirate Map for Treasure Hunting Adventure
3D Tourist Map Illustration with Features Highlight
Modern Data Visualization Graphics on Transparent Panels
Statistics and Data Analysis Infographic with Neon Elements
Digital Data Exploration and Analytics Graphic
Financial Insights Dashboard for Analysis
Financial Dashboard Visualization with Data Insights
Real-Time Analytics Dashboard with Data Visualizations
Modern dashboard interface design
Modern Big Data Technology Promotional Graphic
Spectrum Analyzer Interface Design for Web Display
KPI Infographic for Data Visualization and Analysis
Modern Data Visualization Graphic with Bar Chart and Engaging Design
Market Analysis Graphic with Data Visualization
Stylish Web Page Design Featuring Clear Data Visualization
Interactive Map Feature with 3D Design for Location Identification
Interactive Financial Data Dashboard Promotion
Colorful Infographic Design Illustrating Data Visualization Concepts
3D Visualization of Location Features for Web Design
3D Illustration of Amplitude's Product Analytics Features
3D Visualization of Location Tracking Features
Biometric Scanning Interface for Fingerprint Identification
Dynamic Big Data Technology Visualization Graphic
radar technology illustration
Futuristic Technology Graphic with Digital Elements
Dynamic Data Visualization for Business Process Automation
Professional Data Analysis Presentation Graphic
Dynamic Data Visualization for Business Process Automation
Financial Investment Analysis Graphic with Trend Chart
Vibrant analytics dashboard mockup
Futuristic Technology Promotion Graphic with Interactive Elements
Video Editing Software Interface Illustration
Illustration of Sleep Tracking App Interface
Cinematic Data Display on Laptop with Analytics
Modern Data Analysis Graphic with Insights Theme
Marketing Performance Dashboard Graphic
3D Interactive Slideshow Web Page Design Concept
3D Illustration of Heart-Rate Monitoring Web Page Design
Dynamic Visualization of Big Data Flow Concepts
3D Illustration of Radar Technology with Interactive Elements
3D Graph Analysis Illustration with Insights
Holographic Control Center for AI Interaction Monitoring
Data Analysis Infographic with Modern Design Elements
Promotional Graphic for Data Exploration Theme
Data Visualization of Finance Crisis with Declining Trend
Data Analytics Illustration with Graphs and Percentages
Futuristic Technology Graphic Showcasing AI and Data Flow
World Map with Geographic Information and Exploration Theme
hologram technology in action
Digital Financial Chart Representing Market Growth
Modern KPI Dashboard Displaying Performance Metrics
Informative Graphic on Radar System Functionality
Interactive Animation Promotion Graphic for Video Engagement
Financial Trading Data Visualization for Stocks and Crypto