Search
Sign In
2:3
2:3
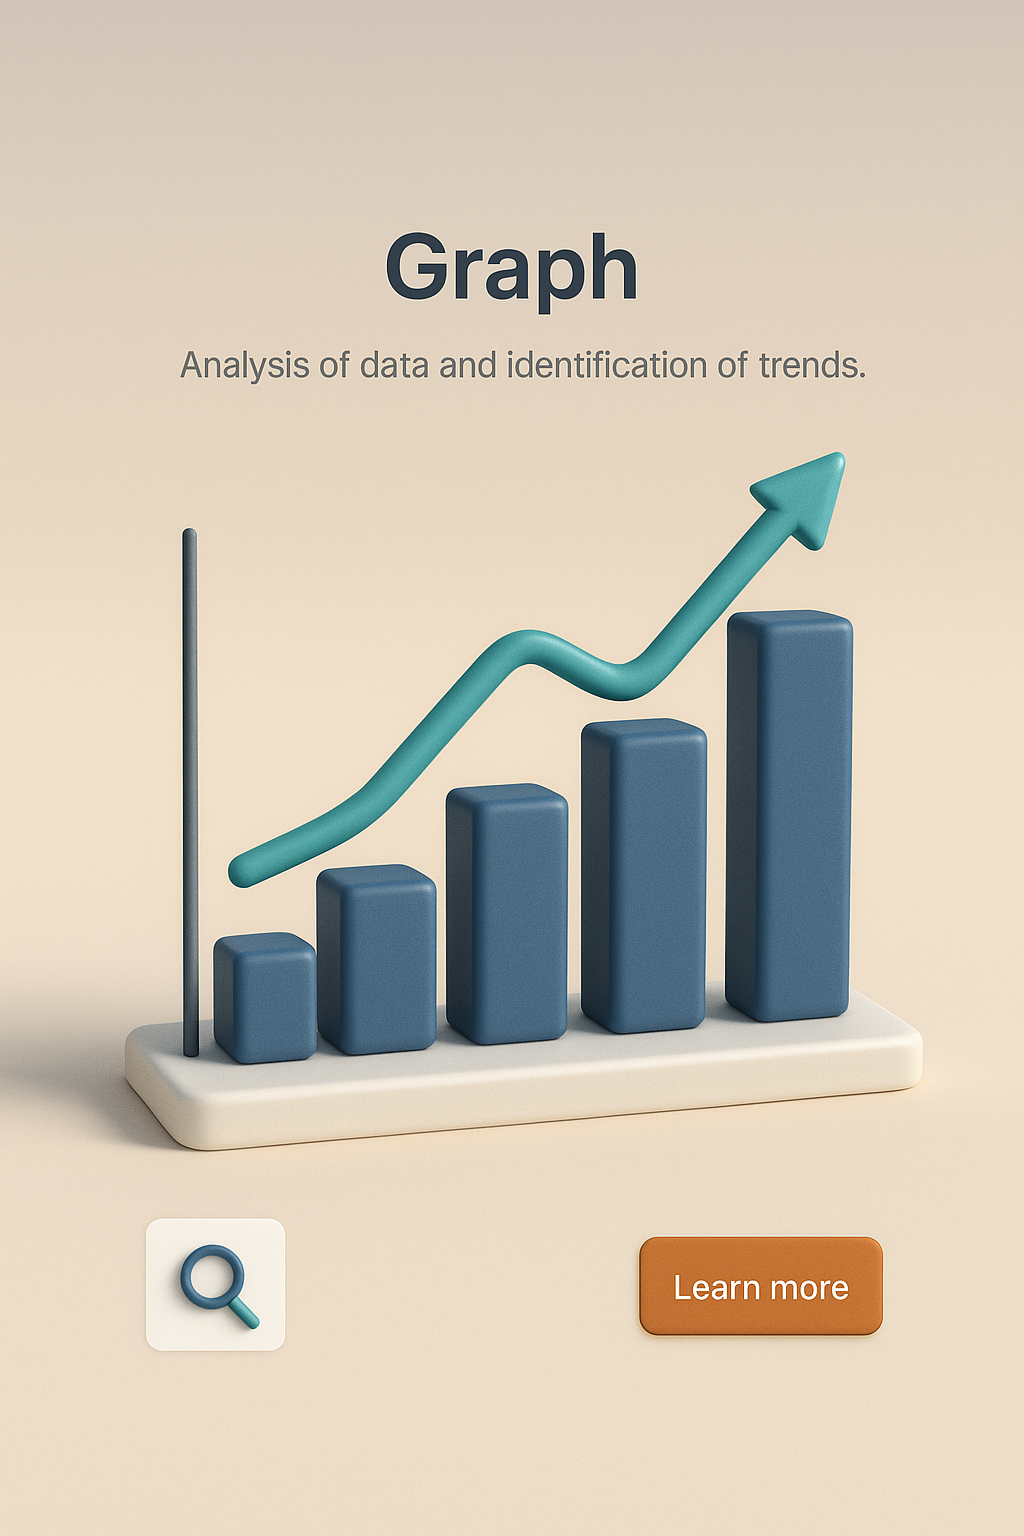
Detailed 3D Graph Illustration for Data Analysis
/
Collection:
Base
/
by davooda
/
Type: PNG
/
A simplistic yet realistic 3D illustration of a graph showcasing data trends. Features a smooth gradient background, small text elements, and a clear call-to-action button.
Detailed 3D Graph Illustration with Text Elements
Detailed 3D Graph Illustration with Action Button and Text
Detailed 3D Illustration of Data Visualization
3D Scene of Data Analysis with Laptop and Graphs
3D Visualization of SEO Data Analysis and Optimization Techniques
Modern Information Design: Data Usage Visualization
Detailed 3D Scene Depicting Data Analysis Process
3D Graph Analysis Illustration with Insights
Fluorescent Shadow Object with Chart Illustration
3D Bar Chart Icon with Magnifying Glass in Isometric View
3D Graph Icon Representing Data Trends
Miniature Real World: Detailed 3D Data Analysis Scene
Infographic on Statistics and Data Analysis in Neon Design
Statistics and Data Analysis Infographic with Neon Elements
3D Magnifying Glass Over Line Graph Icon
3D Scene of Data Analysis and SEO in Vibrant Colors
3D Illustration for Data Analysis Landing Page
Stylized Candlestick Chart Illustration for Financial Data
3D Bar Chart Icon with Magnifying Glass in Isometric View
Crypto Desk with Graphs and Coins for Market Analysis
3D Graph Icon Representing Growth Metrics
Stylish 3D Data Analytics Icon in Isometric View
3D Icon Representing Grid Trading with Volumetric Design
Stylized Bar Chart Icon for Data Visualization
3D Financial Chart Icon with Analysis Elements
Investor Analyzing Data Trends on Laptop (Digital Visualization)
3D Market Analysis Visualization with Graphs and Arrows
3D Bar Chart Icon Representing Growth Metrics
3D Web Design Illustration Featuring Search Functionality
3D Graph and Chart Icons for Data Visualization
3D Protocol Decoder Icon with Graph and Magnifying Glass
3D Magnifying Glass Over Graph Icon for Data Analysis
3D Landing Page Design with Analytics Features
3D Illustration of a Data Analysis Monitor with Graph
3D Icon of a Growth Chart on Clipboard
Stylized 3D Financial Chart Icon for Analysis
Stylized Bar Chart Illustration for Data Visualization
3D Bar Chart Illustration Representing Growth
Modern Information Design for Data Usage Feature
3D Web Design Concept Featuring Growth Metrics
3D Illustration of Statistics with Visual Features
Stylized 3D AUC-ROC Icon with Isometric Design
3D Growth Illustration with Unique Design Elements
3D Isometric Icon of a Growth Chart with Colorful Bars
3D Financial Chart Icon with Graph and Magnifying Glass
3D Trend Icons Representing Upward and Downward Graphs
Stylish 3D Isometric Icon for Presentation Decks
Colorful Infographic Design with Data Visualization Elements
Stylish Landing Page with Soft Pink Gradient Background
3D Blueprint Design with Pencil and Charts
3D Finance Icon with Growing Graph and Coin
Dynamic Font for Automotive Logos in Vibrant 3D Design
3D Data-Mining Icon with Graph and Magnifying Glass
3D Document Icon with Graphs and Pencil Design
3D Bar Chart Illustration Representing Growth
Colorful 3D Bar Chart Icon Representing Data Growth
Colorful 3D Isometric Chart Icon on Transparent Background
3D Graph and Chart Illustrations for Presentations
Modern Document Icon with Graph Elements
Dynamic Business Digital Graph Chart for Growth Investment
Stylized Bar Graph with Upward Trend
3D Icon of a Waveform Representation in Soft Colors
Realistic 3D Atom Scene with Informative Text Display
3D Graph Icon Representing Growth and Progress
Stylized 3D Chart Icon for Document Visualization
3D Mathematical Icon with Graph Representation
3D Fingerprint Design for Biometric Identification
Modern Presentation Slide with 3D Abstract Design
Glossy Candlestick Chart for Financial Data Visualization
3D Visualization of SEO and Data Analysis Concepts
3D Web Page Integration for Feature Promotion
3D Success Icon with Graph and Book Visuals
Modern Trendy Charts Promotional Graphic
Illustrative Graphic for Business Startup Theme
3D Visual Progress Tracker Design for Web Page
Conceptual Growth Illustration with Green Plant
3D Data Analysis Icon with Magnifying Glass
3D Graph Analysis Icon with Magnifying Glass on Transparent Background
Innovative Finance and Money Technology Concept
3D Bar Graph Illustration Representing Growth
3D Graph Presentation on Flip Chart
Detailed 3D Illustration with Background Elements
3D Web Design Integration with Innovative Feature Display
3D Wave-Particle Duality Icon with Isometric View
3D Data Icon Representing Big Data Concepts
3D Bar Graph Displaying Conversion Rates Over Four Months
3D Graph Icon with Magnifying Glass for Analysis
Stylized Graph Icon with Soft Colors and Modern Design
Stylish Blue Triangles Background for IT Company
3D Trend Icons with Upward and Downward Graphs
3D Financial Design for Web Page Integration
3D Icon Representing Growth in Data Analytics
Stylish 3D Revenue Icon with Graph and Coin
3D Chart Icon Representing Growth and Progress
3D Icon Representing Data Mining with Books and Magnifying Glass
3D Coin Background with Finance Graph and Investment Growth
3D Science Illustration with Educational Elements
Stylish 3D Bell Curve Icon with Isometric View
3D Bar Graph Icon Representing Data Visualization
Stylish Web Design Featuring an Analyst with 3D Elements
Abstract 3D Finance Illustration for Digital Business
3D Illustration for Channel Growth Analytics
3D Graph Icon Representing Financial Data Analysis
3D Graph Depicting Decrease with Dramatic Background
Ocean of Price Charts in a 3D Illustration
Modern Data Analysis Graphic with Insights Theme
Colorful Heatmap Location Pin on a Map Graphic
Dynamic 3D Webpage Illustration with Features
Colorful 3D Bar Graph with Isometric View
Dynamic Digital Wave Representation for Data Science Concepts
3D Illustration of Amplitude's Product Analytics Features
3D Glossy Blue Candlestick Chart with Trend Line
3D Oscilloscope Design with Signal Analysis Features
3D Spreadsheet Design with Interactive Elements
Digital Data Exploration and Analytics Graphic
Professional Data Presentation and Evaluation Graphic
Abstract Investment Concept Featuring Stock Market Growth Visualization
3D Glass Effect Pie Chart Illustration
3D Bar Chart with Heart Icon for Data Visualization
Stylized Financial Growth Chart Graphic for Data Visualization
3D Bar Chart with Downward Trend Indicator
Dynamic 3D Composition for Trade Analysis
Financial Monitoring Graphic with Exchange Rate Visualization
Stylized 3D Graph Icon with Colorful Axes
Dynamic 3D Wave Landscape for Data Science Visualization
Financial Investment Analysis Graphic with Trend Chart
3D Cash Stack with Feature Blocks for Web Design
Stylized 3D Pie Chart in Gradient Colors
3D Bar Graph Representation of Conversion Rate Changes
Crystal Ball Visualization of Future Crypto Price Trends
Stylized 3D Glass Chart Icon with Gradient Colors
Ocean Waves Visualizing Market Trends and Analysis
3D Bar Graph Representing Conversion Rate Changes Over Time
Dynamic Stock Market Financial Charting Visual
3D Graphic Landing Page for Report Generation Product
User Ratings Visualization with 3D Bar Chart
Modern Data Visualization Graphic with Bar Chart and Engaging Design
3D Illustration for Forecasting Features on a Landing Page
Professional Data Analysis Presentation Graphic
3D Icon of Data Analysis with Graph Elements
Financial Insights Dashboard for Analysis
3D Bar Graph with Star Symbol Representing Growth
Financial Trading Data Visualization for Stocks and Crypto
Financial Growth Chart Graphic for Investment Trading
3D Web Page Design Featuring Growth Metrics and Features
3D Bar Graph Icon with Presentation Board
Market Analysis Graphic with Data Visualization
3D Visualization of Decrease Concept with Graph and Arrow
Crystal Ball Illustrating Future Cryptocurrency Trends
Abstract Financial Growth Background with Chart Indicators